Gold drops toward $4,050 as US CPI fuels speculation of larger Fed rate hike
- Gold falls, erasing Monday’s gains as hotter-than-expected US inflation lifts the US Dollar.
- US CPI data strengthens expectations of a December Fed rate hike, with markets fully pricing in a 25-bps increase.
- XAU/USD holds above the 20-day SMA near $4,061, while RSI signals neutral momentum.
Gold (XAU/USD) extends its intraday decline on Tuesday after US inflation came in hotter than expected. The metal is down about 2.20%, erasing all of the previous day’s gains as the US Dollar strengthens. At the time of writing, XAU/USD trades around $4,050, down from Monday’s high near $4,148.
The US Consumer Price Index (CPI) rose 0.4% MoM in October, above the 0.3% forecast but down from 0.6% in September. Core CPI, which excludes food and energy, increased 0.3%, the same as in September and above the 0.2% expected. The Bureau of Labor Statistics (BLS) did not publish annual CPI figures for October because of last year’s government shutdown.
The US Dollar Index (DXY), which tracks the Greenback against a basket of six major currencies, climbs above 102.00 after touching an intraday low of 101.49. The stronger-than-expected inflation data reinforced expectations that the Federal Reserve (Fed) will raise rates in December.
Earlier on Tuesday, Fed Governor Christopher Waller said he would “still support a 25 basis point increase” in December even if October inflation cooled. He added that a “half-point Fed rate hike may be needed in December” if October core CPI comes in “around 0.3% or higher.”
Traders now assign an 85.3% chance to a 25-basis-point (bps) hike and a 14.7% chance to a 50-basis-point hike, according to the CME FedWatch Tool. The hawkish Fed outlook remains a headwind for Gold, as higher interest rates raise the opportunity cost of holding the non-yielding metal. A firmer Greenback also makes Gold more expensive for buyers using other currencies.
A Reuters poll conducted November 6-10 showed that all 101 economists expect the Fed to raise rates by 25 bps in December. However, views are divided on what comes next, with 56 expecting December to mark the final hike of the current cycle, while 45 see at least two more increases.
However, a sustained decline in Oil prices could ease inflation pressure and reduce the need for further Fed tightening. West Texas Intermediate (WTI) slips toward $84 a barrel, its lowest level since August 31, and is down more than 15% so far this month. US President Donald Trump said there was “positive momentum” toward ending the war with Iran after talks with Qatar’s prime minister at the White House on Monday.
Technical Analysis: $4,000 level in focus
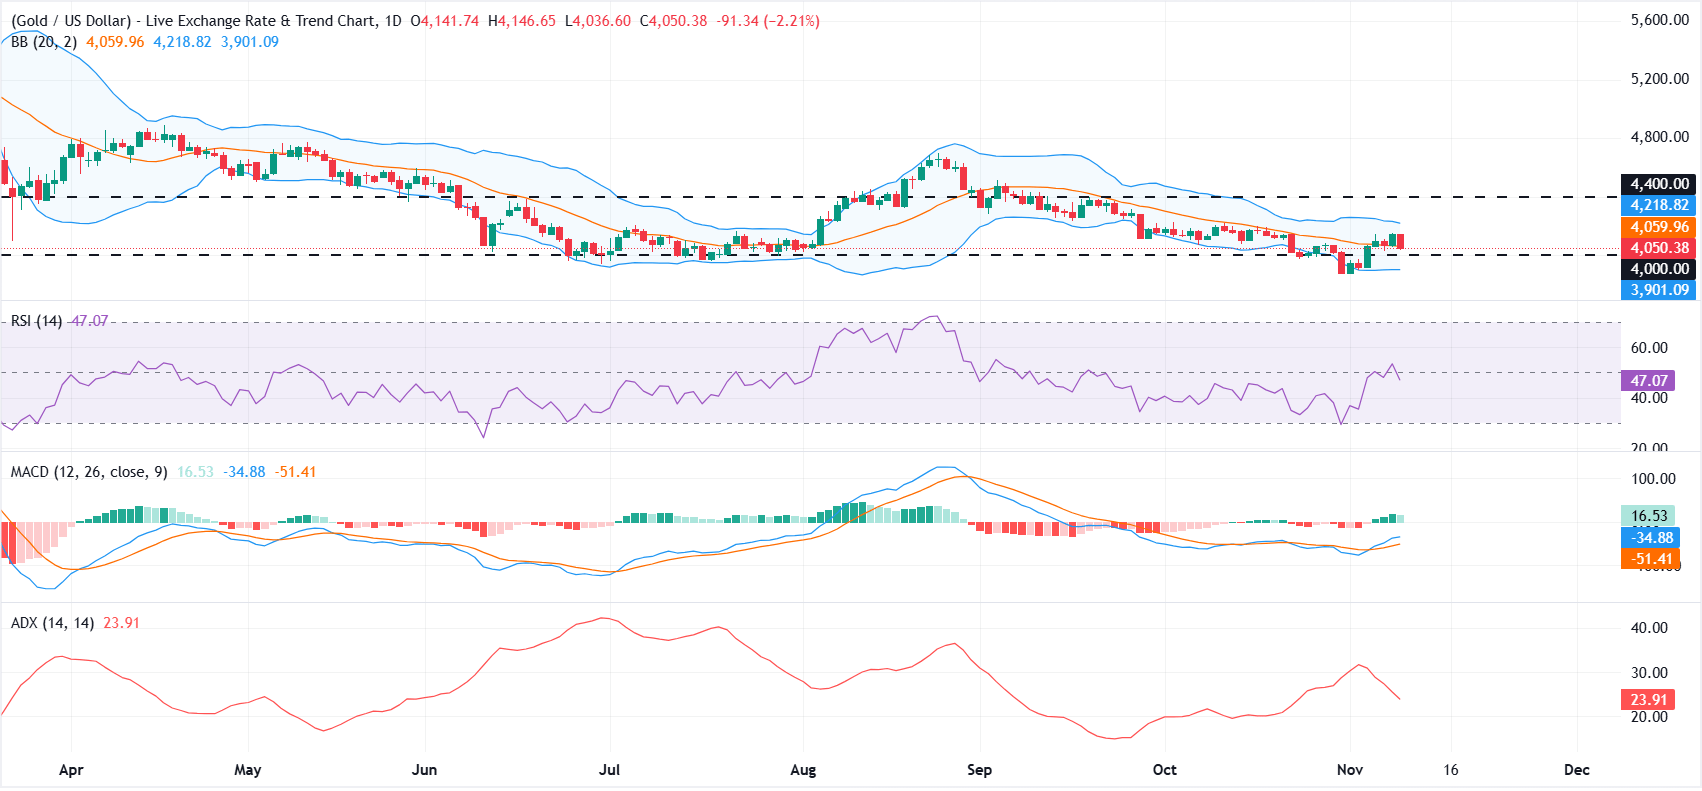
On the daily chart, XAU/USD keeps a mildly bearish near-term bias as it holds below the 20-day Bollinger simple moving average (SMA) at roughly $4,059 while still confined inside the bands. The Bollinger lower band near $3,900 cushions the downside for now, but the inability to reclaim the mid-band keeps rallies capped.
Momentum is stabilizing, with the Relative Strength Index (RSI) hovering just below the 50 line and Moving Average Convergence Divergence (MACD) firmly positive, yet the Average Directional Index (ADX) near 24 suggests only a modest trend.
On the topside, initial resistance emerges at the 20-day Bollinger SMA around $4,060, followed by the upper Bollinger band near $4,218, with a more significant horizontal barrier at $4,400 limiting any stronger advance. On the downside, immediate support is seen at the psychological $4,000 level. Further losses could expose the lower Bollinger Band near $3,901, followed by the year-to-date low at $3,870.
(The technical analysis of this story was written with the help of an AI tool. Know more.)
Inflation FAQs
Inflation measures the rise in the price of a representative basket of goods and services. Headline inflation is usually expressed as a percentage change on a month-on-month (MoM) and year-on-year (YoY) basis. Core inflation excludes more volatile elements such as food and fuel which can fluctuate because of geopolitical and seasonal factors. Core inflation is the figure economists focus on and is the level targeted by central banks, which are mandated to keep inflation at a manageable level, usually around 2%.
The Consumer Price Index (CPI) measures the change in prices of a basket of goods and services over a period of time. It is usually expressed as a percentage change on a month-on-month (MoM) and year-on-year (YoY) basis. Core CPI is the figure targeted by central banks as it excludes volatile food and fuel inputs. When Core CPI rises above 2% it usually results in higher interest rates and vice versa when it falls below 2%. Since higher interest rates are positive for a currency, higher inflation usually results in a stronger currency. The opposite is true when inflation falls.
Although it may seem counter-intuitive, high inflation in a country pushes up the value of its currency and vice versa for lower inflation. This is because the central bank will normally raise interest rates to combat the higher inflation, which attract more global capital inflows from investors looking for a lucrative place to park their money.
Formerly, Gold was the asset investors turned to in times of high inflation because it preserved its value, and whilst investors will often still buy Gold for its safe-haven properties in times of extreme market turmoil, this is not the case most of the time. This is because when inflation is high, central banks will put up interest rates to combat it. Higher interest rates are negative for Gold because they increase the opportunity-cost of holding Gold vis-a-vis an interest-bearing asset or placing the money in a cash deposit account. On the flipside, lower inflation tends to be positive for Gold as it brings interest rates down, making the bright metal a more viable investment alternative.
Author

Vishal Chaturvedi
FXStreet
I am a macro-focused research analyst with over four years of experience covering forex and commodities market. I enjoy breaking down complex economic trends and turning them into clear, actionable insights that help traders stay ahead of the curve.











