Gold’s three clocks


Gold slipped as low as roughly $3,830 an ounce on 16 November, its weakest level in more than a year. The dollar was strengthening, and markets were assigning about a 94% probability to a quarter-point Federal Reserve rate increase in December. Three days earlier, the yield on a 10-year US inflation-protected Treasury stood at 2.91%. For an asset that pays no interest, that is serious competition.
I am interested in the other side of that trade. The interest rates making gold less attractive now are also working through years of mortgages, corporate borrowing, property valuations and government debt. Some borrowers feel the change immediately. Others will not face it until a loan matures. The economic consequences can arrive later still. The question is whether the system can absorb those pressures without changing the monetary environment that matters for gold.
I was a junior fixed-income trader as the global financial crisis unfolded in 2007. Watching credit and asset prices turn against one another left an impression. In the years afterwards — perhaps fifteen years ago — I began to worry about how much economic activity had come to depend on asset prices staying high. I thought of it as a house of cards, although that phrase describes a concern, not a prediction of another crash.
When a house appreciates, its owner may feel wealthier, but the impact goes further. The property can support a larger loan. Banks have more collateral. Spending and investment become easier to finance. If prices fall while the debt remains, the same mechanisms begin to work in reverse. I have become more interested in that interaction than in the headline size of global debt.
The three clocks of higher interest rates
The first is the market clock. Bond prices and equity valuations react as investors revise their expectations. Property investors require higher yields, reducing what they will pay for a given rental income. Gold responds to real interest rates, the dollar and demand for liquidity. This is the clock visible on the screen today.
The second is the refinancing clock. A company that issued a five-year bond when money was cheap can continue paying the old coupon until maturity. A homeowner with a fixed mortgage enjoys the same protection, temporarily. Floating-rate borrowers feel higher rates sooner. The effects of previous rate increases can therefore continue long after a central bank pauses.
The third is the economic clock. Larger repayments leave less money for consumption and investment. Weaker demand can affect employment, credit quality and tax receipts. Falling collateral values can make new financing harder to secure, particularly for borrowers who most need it.
For gold, these clocks can point in opposite directions. The first may weigh on the price as real yields rise. The slower clocks might eventually support gold, but only if they change market real yields or investors’ confidence in financial claims. There is no guarantee that they will.
When a mortgage resets and a house loses value
Britain offers a particularly clear example because many mortgages are fixed for relatively short periods. In July, the Bank of England projected that a little over five million households would see mortgage payments increase by the end of 2028. Almost 750,000 borrowers leaving deals below 3% during 2026 faced an estimated average increase of £170 a month. Across the wider group of owner-occupiers refinancing over the following two years, the typical projected increase was only £45.
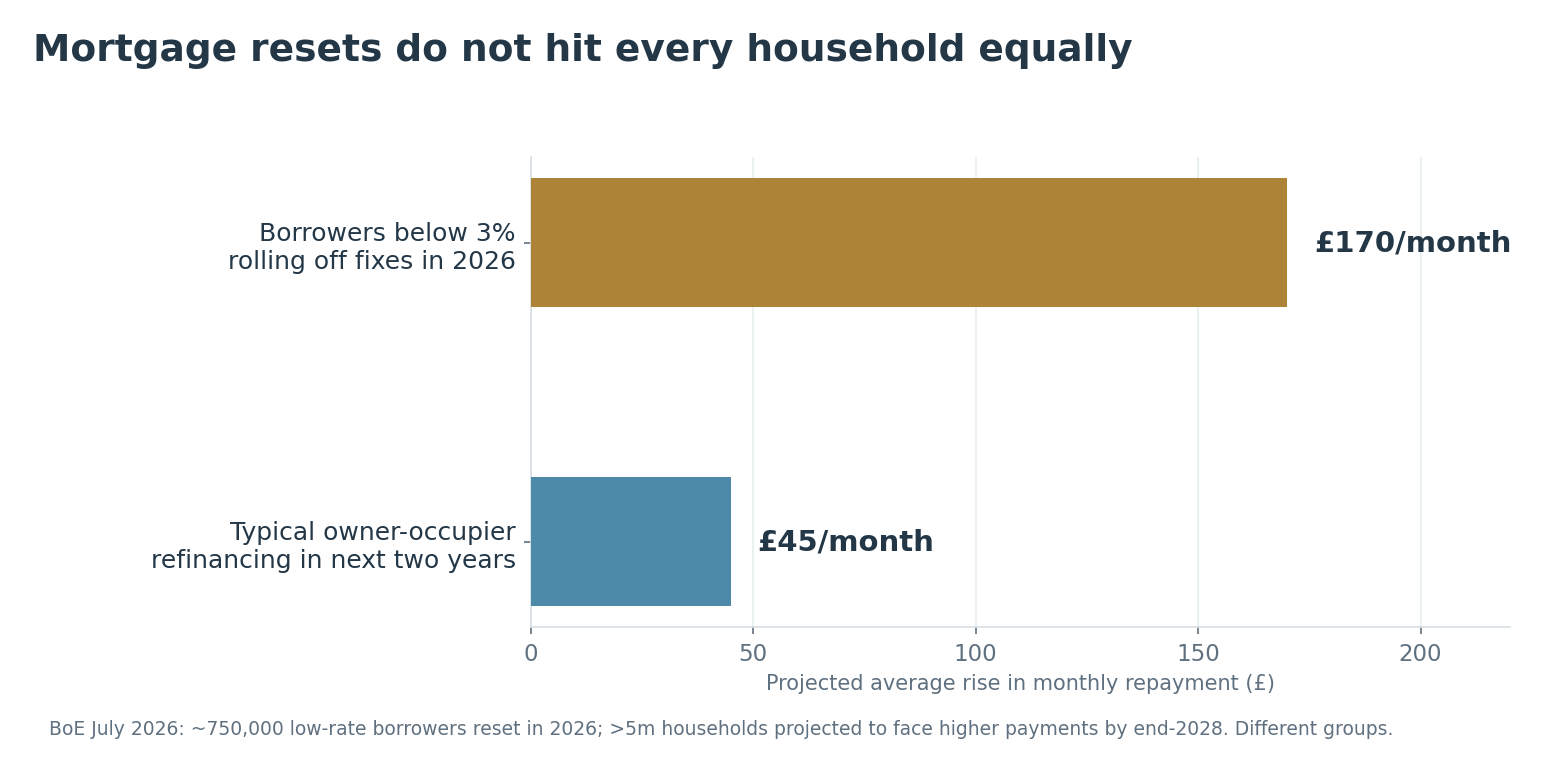
Different borrowers face very different mortgage resets. Bank of England estimates, July 2026. Figures refer to different cohorts.
Consider the arithmetic on an illustrative £300,000 repayment mortgage with 25 years left. A rate of 2% produces a payment of roughly £1,272 a month; at 5%, it becomes about £1,754. That is £482 a month unavailable for other spending, unless the borrower adjusts the loan or finds the money elsewhere. It is not the typical British mortgage increase, but it shows why the timing of a reset matters.
Now combine that with a falling property price. The borrower's monthly cash flow is tighter, while the asset supporting the debt is worth less. Moving house, remortgaging or borrowing against equity can become less attractive. Even households that keep up with every payment may spend more cautiously.
I have a small illustration close to home. I bought a UK property about a year ago; a neighbouring house, although not identical, is now being advertised for roughly 20% less than I paid. An asking price on a different home tells us little about the value of mine, let alone the wider market. It does, however, make the possibility of a thinner collateral cushion quite tangible.
The wider UK evidence is mixed but worth attention. In its November report, the Bank of England said mortgage approvals for house purchase had declined 8% over the three months to September, compared with the preceding three months. The official house-price index fell 0.8% over a separate three-month period to August. Neither number establishes a crash.
The collateral channel is more than a story about confidence. A February 2026 Bank of England working paper used roughly six million mortgage-expiry comparisons and estimated that a one-percentage-point cut in mortgage rates increased consumption by around 3% over the next six months. Much of that effect came from borrowing against higher house prices rather than simply spending the interest savings. The authors studied rate reductions, so the result cannot be reversed mechanically to quantify the impact of increases. It does show how property values can influence spending through credit.
Countries will experience this differently. Many US homeowners hold long-term fixed mortgages and are protected from an immediate payment reset, even while new buyers and housing transactions are affected. The maturity structure matters as much as the headline debt ratio.
The problem extends beyond households
A commercial-property owner can suffer a similar squeeze before tenants stop paying rent. Suppose a building generates £5 million in annual net income. At a required yield of 5%, its illustrative value is £100 million. At 6.5%, the same income supports a value of about £77 million — a 23% decline. A lightly indebted owner may be able to wait. A borrower refinancing against the lower valuation may have to inject equity or sell.
The corporate sector contains a more troubling version of this problem. The IMF's October 2026 Global Financial Stability Report found that so-called zombie firms — businesses whose earnings had failed to cover interest for at least three consecutive years — accounted for 21.4% of corporate debt across ten Asian economies at the end of 2025, up from less than 10% in 2008. This is a share of debt in a defined regional sample, not a global proportion of companies.
Some lenders have an incentive to extend loans to weak borrowers rather than recognise losses. Cheap refinancing can postpone a difficult adjustment; expensive refinancing can force it. The danger is that restructuring, reduced investment and job losses arrive together. The counterargument matters too: allowing unproductive companies to restructure can improve the allocation of capital over time. Keeping them alive indefinitely is not costless either.
Government finances sit in the same network. US federal net interest costs reached about $1.05 trillion in fiscal 2026, against roughly $5.4 trillion in receipts — close to one dollar in five. The Congressional Budget Office projected in September that debt held by the public could rise from 101% of GDP in 2026 to 175% in 2056 under its extended baseline, or 222% under a higher-interest-rate scenario. Those are modelled paths, not a date for a crisis.
Higher public interest costs can limit a government's room to respond just when weaker housing and corporate activity begin to hurt tax receipts. Yet central banks may still need to keep rates high because inflation has not been defeated. The Bank of England actually raised Bank Rate to 4% in November despite reporting a softer housing market. That is the tension, not an inconsistency.
So why should any of this matter for Gold?
The simple debt argument is disappointing as a predictor. In an annual comparison covering 1971–2025, changes in US federal debt held by the public as a share of GDP and changes in gold's annual-average dollar price had a correlation of about +0.08. Removing 2020 reduced it to about +0.02. Debt levels and gold prices both trend upwards over long periods, but correlating those levels would be a misleading test of predictive power.
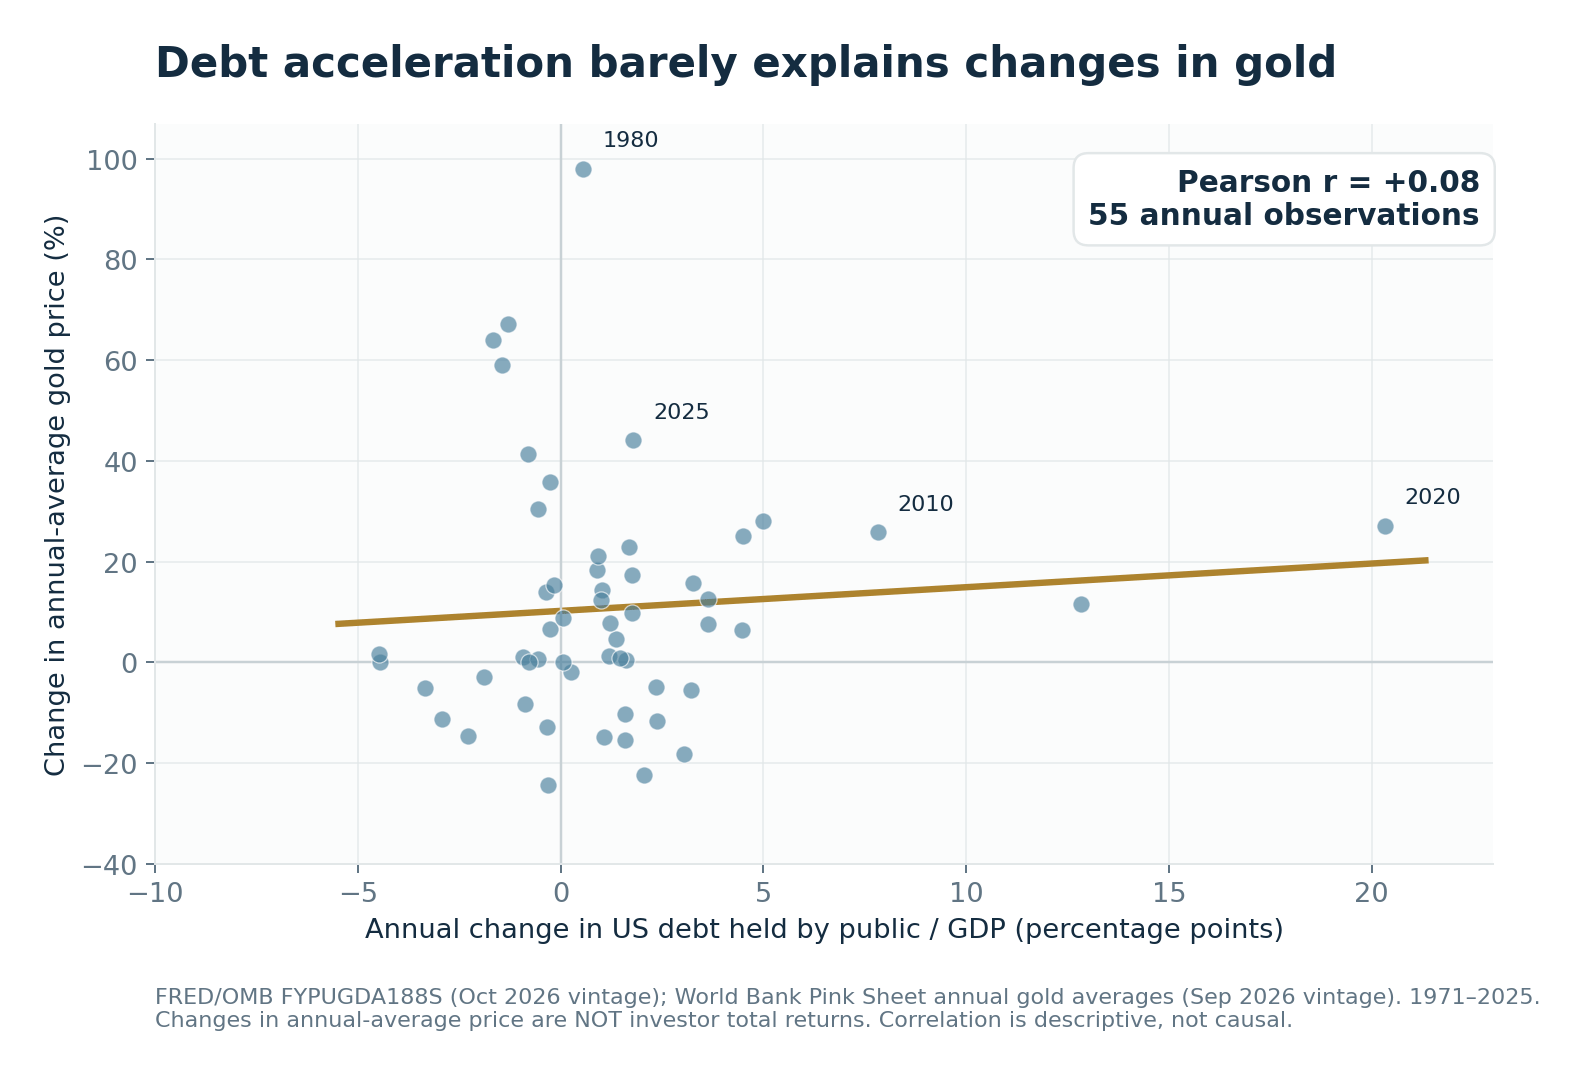
The direct annual relationship is weak. US public debt/GDP and World Bank gold annual averages, 1971–2025; descriptive comparison, not a trading model.
That result does not answer the more interesting question: does a high existing level of debt make an economy, or gold, respond differently to a rate shock? The mortgage and credit research gives reasons to investigate it, but this article does not establish an empirical gold-return result for that hypothesis.
The better-established gold link runs through real interest rates. Chicago Fed research found a negative historical association between long-term real yields and the real price of gold. Higher inflation-adjusted returns on safe bonds can raise the opportunity cost of holding a metal with no coupon. That explains part of today's market without answering what happens next.
If tightening eventually weakens growth and reduces market real yields, gold may become more attractive. But a cut in a central bank's policy rate is not enough on its own: long-term nominal yields and expected inflation can move differently. There is also a second channel, in which investors doubt the future purchasing power of government promises and choose to diversify into an asset with no issuer. Gold may benefit from that concern even when rates are elevated. The World Gold Council estimates that central banks bought a net 675 tonnes in the first nine months of 2026; that demonstrates demand, not a single agreed motive for buying. Equally, a liquidity squeeze can force investors to sell gold to raise cash.
I would therefore watch mortgage resets, lending standards, employment, corporate refinancing and credit spreads, but also the variables closest to the metal itself: real yields, the dollar and actual investment demand. Evidence that borrowers are struggling is not yet evidence that gold should rise.
The cost of arriving too early
There is another lesson from gold's own history. Using World Bank monthly averages, the metal's price was below its 1981 annual average in 276 of the following 288 months, from 1982 through 2005. That is a nominal benchmark comparison, not the realised return on a particular purchase. Inflation and holding costs made the long wait more painful.
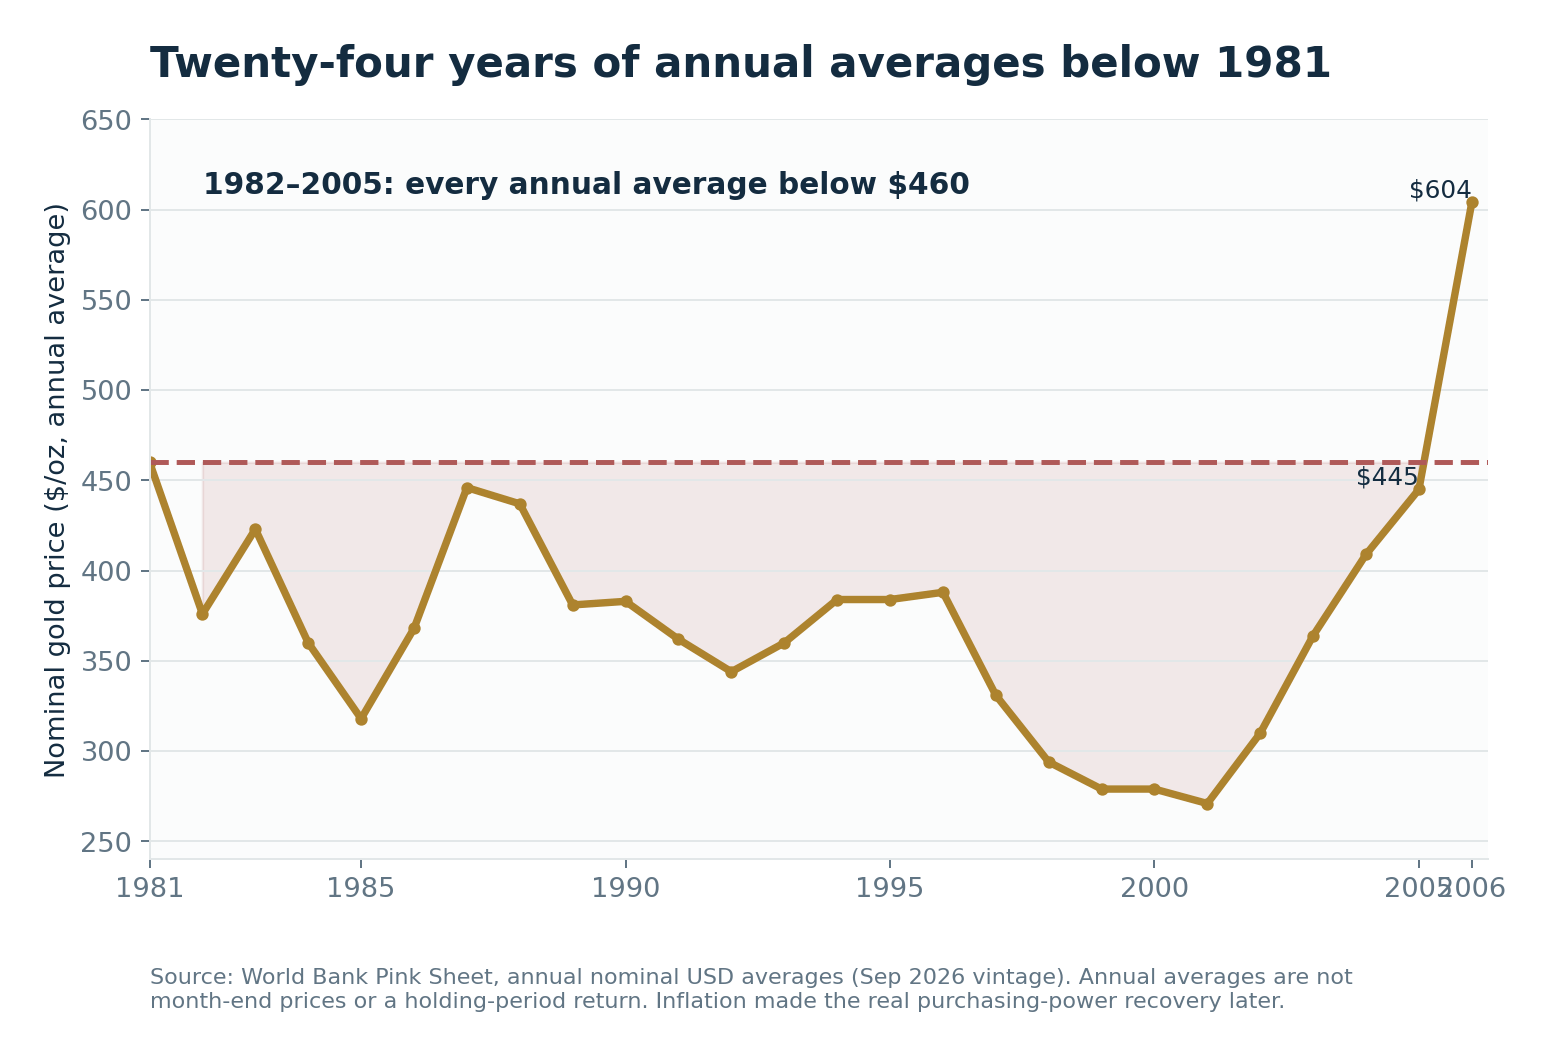
Even a persuasive monetary thesis can take decades to reward an owner. World Bank annual gold averages, US dollars per ounce; nominal values.
I hold physical gold without leverage because that structure suits the time horizon I am prepared to accept. It is not a judgement that everyone should do the same. There are premiums, storage costs, taxes, concentration risks and an opportunity cost. A short-term trader has a different task: finding an entry with a defensible advantage and sizing the position so it survives a move against the thesis.
What I took from the financial crisis was not that asset prices must keep rising forever. It was that debt and asset values can reinforce one another on the way up and magnify the adjustment on the way down. Higher rates expose those connections at different speeds. Gold is responding to the first clock now. I am watching what the other two eventually do to the price of money.
Author
Prakash Bhudia
Deriv
Prakash Bhudia, HOD – Product & Growth at Deriv, provides strategic leadership across crucial trading functions, including operations, risk management, and main marketing channels.