Why Nvidia might not trigger a broader market sell off

The sell off in Nvidia’s stock has focused minds on the outlook for US stocks in the second half of this year. It also shines a light on volatility indicators, which have been at depressed levels for the last few months. The Vix, which measures volatility in the S&P 500, has moved higher in recent sessions. It is currently at 13.4, which is still below the average for the last 12 months of 14.5. Thus, this sell-off is not particularly volatile so far, which explains why the sell off in Nvidia and Super Micro Computer have not led to a broader sell off in other asset classes, or in other regions.
Large cap US stocks help to stabilize index
Some may wonder why a sharp 11% drop in Nvidia’s share price over the last 5 days has not triggered a deeper sell-off, since it is one of the most influential stocks on the US blue chip stock market. This is because the correlation between the top 50 most highly valued companies on the S&P 500 is low.
The chart below shows the CBOE 3-month implied correlation index of the 50 largest stocks on the S&P 500. This shows how correlated the top 50 stocks on the S&P 500 are with each other. While it is not a measure of volatility, it does show how the biggest stocks on the US index move together. Last week, the implied correlation fell to its lowest level in 18 years. This suggests that the mega cap stocks in the S&P 500 do not move in line with each other, and when one stock falls, another rises, which maintains balance in the index and keeps volatility low.
The 3-month correlation has since picked up to 11, but it still remains well below its 1-year average of 19.
CBOE three-month implied correlation of the top 50 largest stocks on the S&P 500
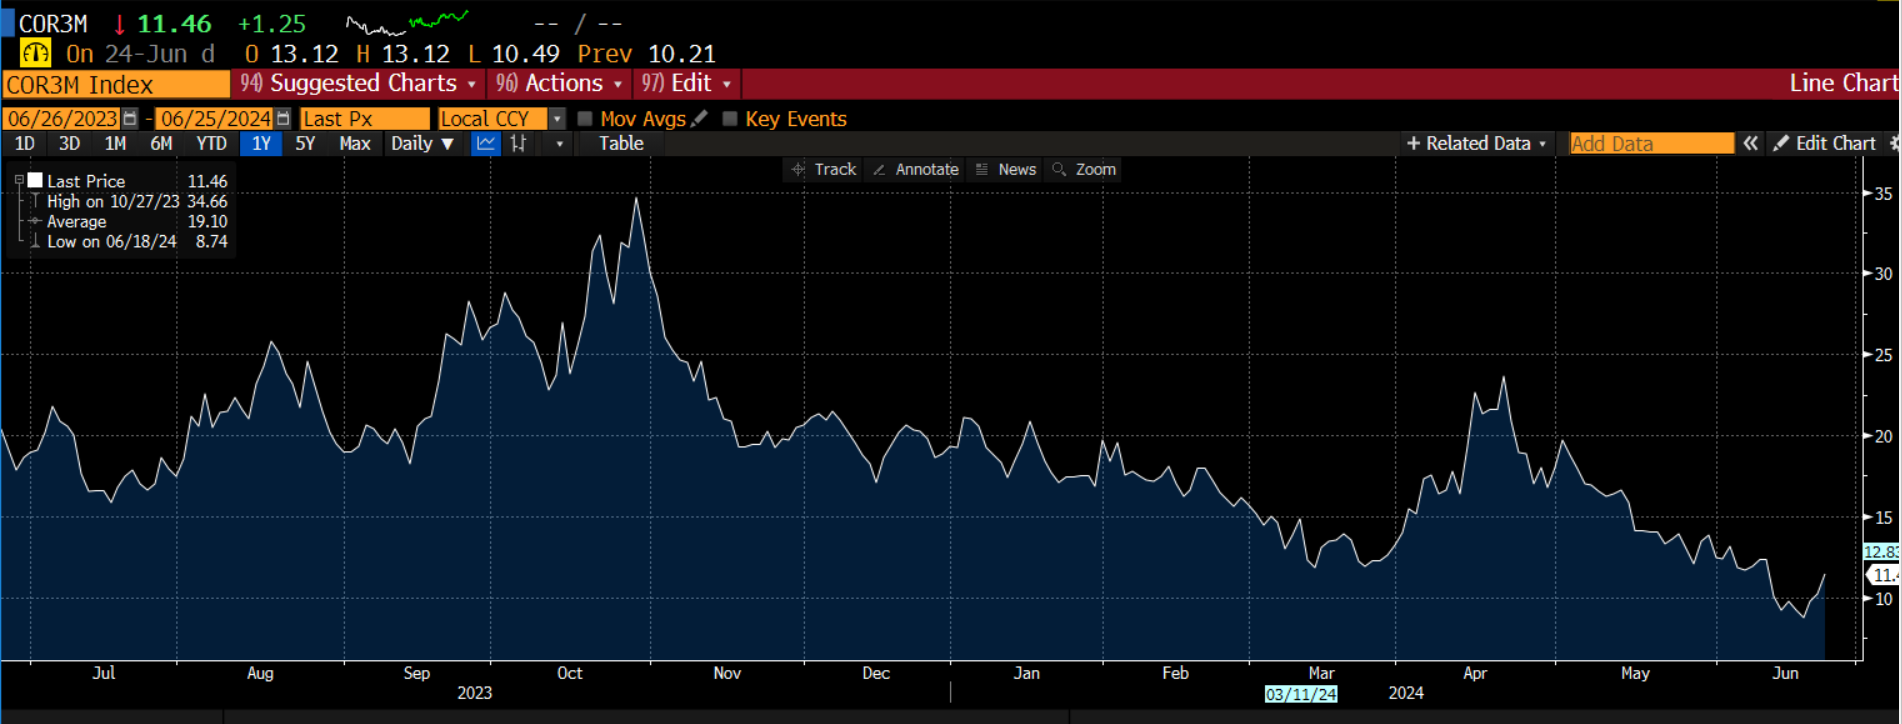
Source: XTB and Bloomberg
This suggests two things:
1, The correlation between the 50 biggest stocks on the S&P 500 is rising, but it is not at an elevated level.
2, This means that Nvidia’s sell-off may not drag the rest of the S&P 500 lower. If the other large stocks on the index continue to move independently of Nvidia, then the AI stock sell off may not have a major impact on the S&P 500.
We will continue to watch this correlation index as it is a good measure of risk sentiment. If it starts to rise, then it could be a signal that a broader stock market sell-off is on the cards.
Author

Kathleen Brooks
XTB UK
Kathleen has nearly 15 years’ experience working with some of the leading retail trading and investment companies in the City of London.


