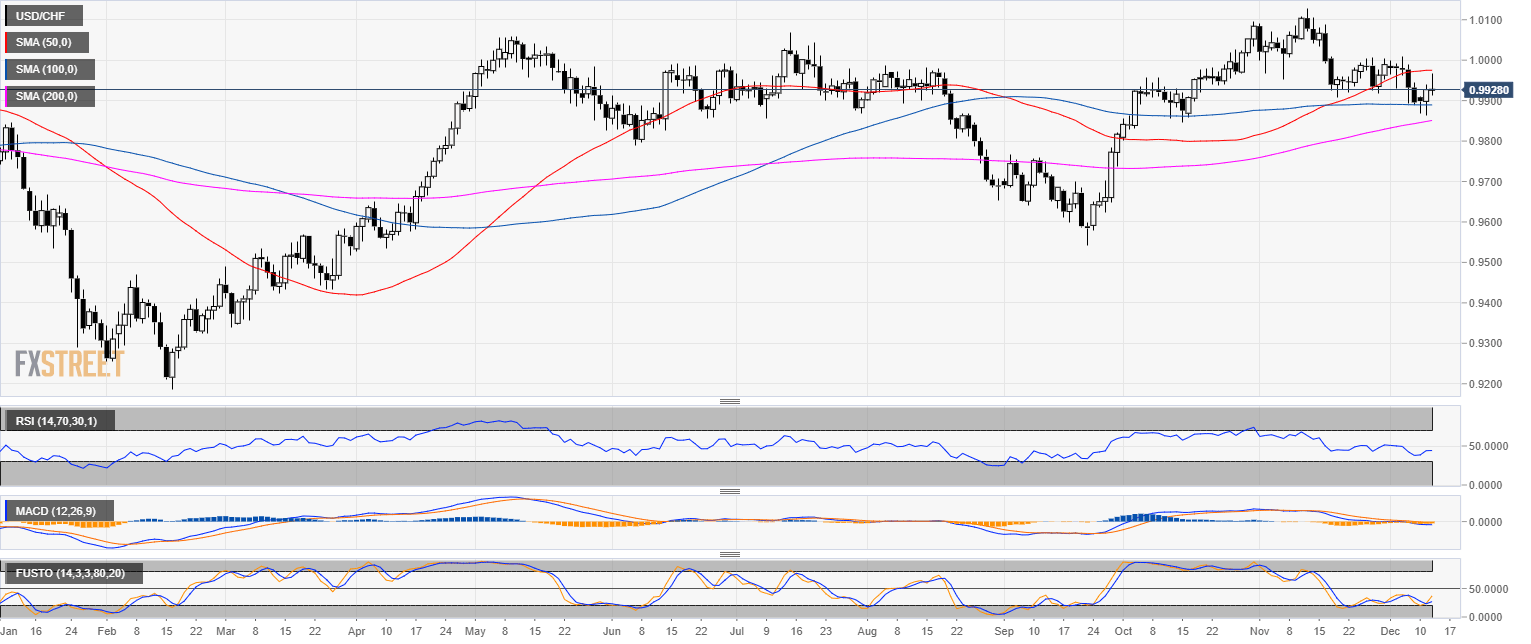
USD/CHF daily chart
- USD/CHF is trading in a bull trend above the 200-day simple moving average (SMA).
- USD/CHF rejected the 50 SMA this Wednesday.
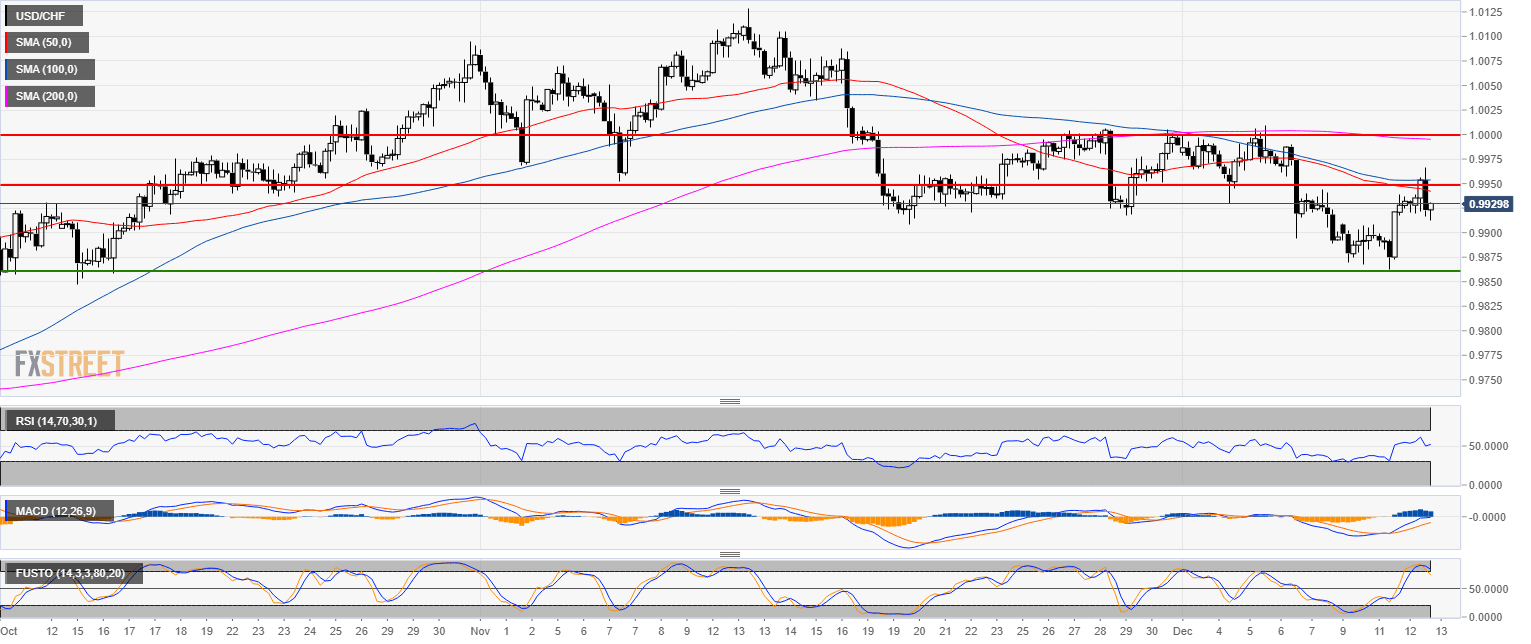
USD/CHF 4-hour chart
- Bulls are ultimately targeting the parity level but 0.9960 resistance must be cleared first.
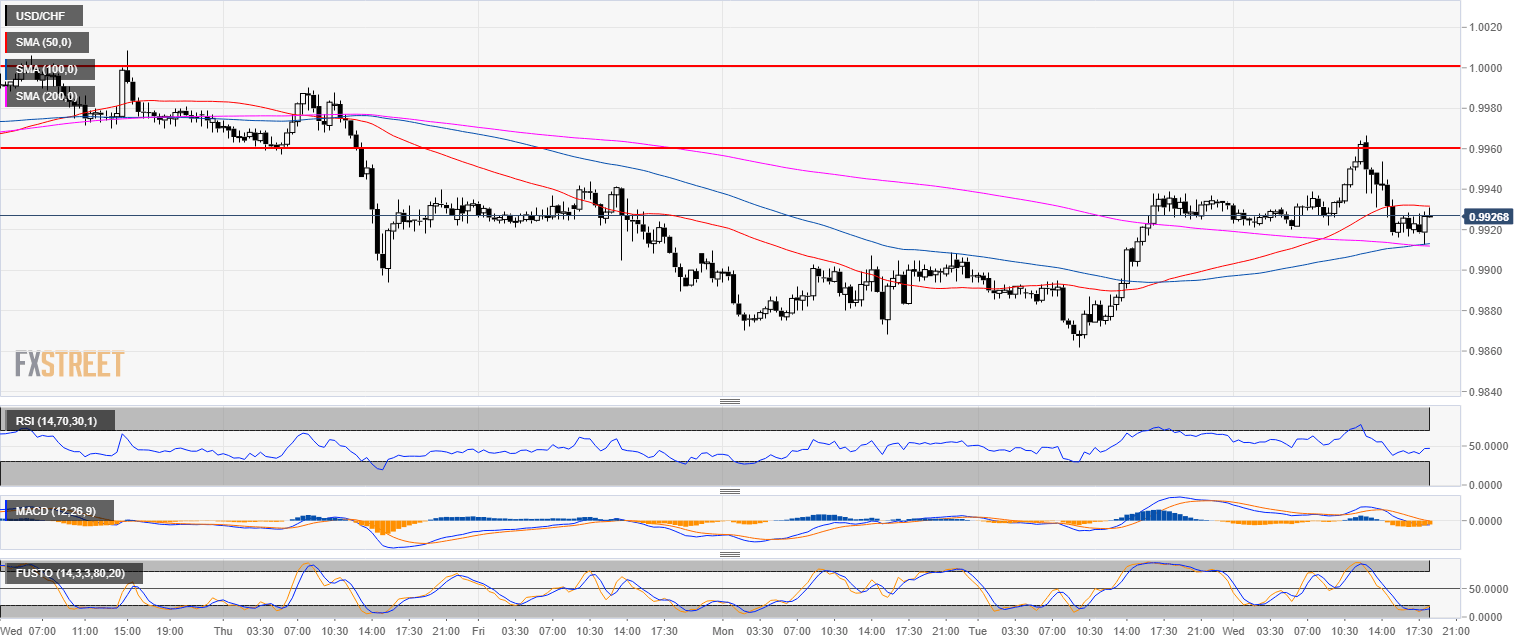
USD/CHF 30-minute chart
- USD/CHF bulls found support at the 100 and 200 SMA.
- Buyers will likely try to get reach the 0.9960 level.
Additional key levels
USD/CHF
Overview:
Today Last Price: 0.9926
Today Daily change: -1.0 pips
Today Daily change %: -0.0101%
Today Daily Open: 0.9927
Trends:
Previous Daily SMA20: 0.9967
Previous Daily SMA50: 0.9975
Previous Daily SMA100: 0.989
Previous Daily SMA200: 0.9845
Levels:
Previous Daily High: 0.9939
Previous Daily Low: 0.9862
Previous Weekly High: 1.0009
Previous Weekly Low: 0.9889
Previous Monthly High: 1.0129
Previous Monthly Low: 0.9908
Previous Daily Fibonacci 38.2%: 0.991
Previous Daily Fibonacci 61.8%: 0.9891
Previous Daily Pivot Point S1: 0.988
Previous Daily Pivot Point S2: 0.9832
Previous Daily Pivot Point S3: 0.9803
Previous Daily Pivot Point R1: 0.9957
Previous Daily Pivot Point R2: 0.9986
Previous Daily Pivot Point R3: 1.0034
Note: All information on this page is subject to change. The use of this website constitutes acceptance of our user agreement. Please read our privacy policy and legal disclaimer. Opinions expressed at FXstreet.com are those of the individual authors and do not necessarily represent the opinion of FXstreet.com or its management. Risk Disclosure: Trading foreign exchange on margin carries a high level of risk, and may not be suitable for all investors. The high degree of leverage can work against you as well as for you. Before deciding to invest in foreign exchange you should carefully consider your investment objectives, level of experience, and risk appetite. The possibility exists that you could sustain a loss of some or all of your initial investment and therefore you should not invest money that you cannot afford to lose. You should be aware of all the risks associated with foreign exchange trading, and seek advice from an independent financial advisor if you have any doubts.
Recommended content
Editors’ Picks
EUR/USD alternates gains with losses near 1.0720 post-US PCE

The bullish tone in the Greenback motivates EUR/USD to maintain its daily range in the low 1.070s in the wake of firmer-than-estimated US inflation data measured by the PCE.
GBP/USD clings to gains just above 1.2500 on US PCE

GBP/USD keeps its uptrend unchanged and navigates the area beyond 1.2500 the figure amidst slight gains in the US Dollar following the release of US inflation tracked by the PCE.
Gold keeps its daily gains near $2,350 following US inflation

Gold prices maintain their constructive bias around $2,350 after US inflation data gauged by the PCE surpassed consensus in March and US yields trade with slight losses following recent peaks.
Bitcoin Weekly Forecast: BTC’s next breakout could propel it to $80,000 Premium

Bitcoin’s recent price consolidation could be nearing its end as technical indicators and on-chain metrics suggest a potential upward breakout. However, this move would not be straightforward and could punish impatient investors.
Week ahead – Hawkish risk as Fed and NFP on tap, Eurozone data eyed too

Fed meets on Wednesday as US inflation stays elevated. Will Friday’s jobs report bring relief or more angst for the markets? Eurozone flash GDP and CPI numbers in focus for the Euro.