USD/CHF Price Forecast: RSI nears overbought territory as bulls remain in control
- USD/CHF rises to a 16-month high as the SNB holds its policy rate at 0%.
- USD/CHF preserves its bullish structure above all major daily moving averages.
- Momentum approaches overbought levels, raising the risk of a short-term pullback.

USD/CHF climbs to its highest level since May 2025 on Thursday as the Swiss Franc (CHF) weakens across the board following the Swiss National Bank’s (SNB) decision to leave its policy rate unchanged at 0%. The decision contrasts with other major central banks, which have raised borrowing costs to counter inflation linked to higher Oil prices. A stronger US Dollar (USD) adds to the pair’s upside as traders price in additional Federal Reserve (Fed) tightening. At the time of writing, the USD/CHF trades around 0.8275, up 0.27% on the day.
Franc lags as SNB holds at zero and pushes back on hike expectations
Analysts at Brown Brothers Harriman highlight that the Swiss Franc “underperformed with the SNB stuck at ground zero.” More notably, they point out that the SNB “pushed back against market pricing 50 to 75bps of hikes in the next twelve months,” signalling little appetite to follow the tightening path implied by recent market moves.
BBH notes that the central bank stressed “monetary policy is appropriate” to keep inflation within its price stability mandate of “less than 2% per annum.” Although the SNB’s inflation projection was “raised slightly due to higher prices for oil products,” BBH underscores that it “remains below 1% over the entire forecast horizon,” reinforcing the case for policy inertia. BBH’s bottom line is that the “widening US-Swiss and EU-Swiss yield gap will keep upside pressure on USD/CHF and EUR/CHF,” as the Franc continues to lag peers anchored by more hawkish rate expectations.
Technical Analysis
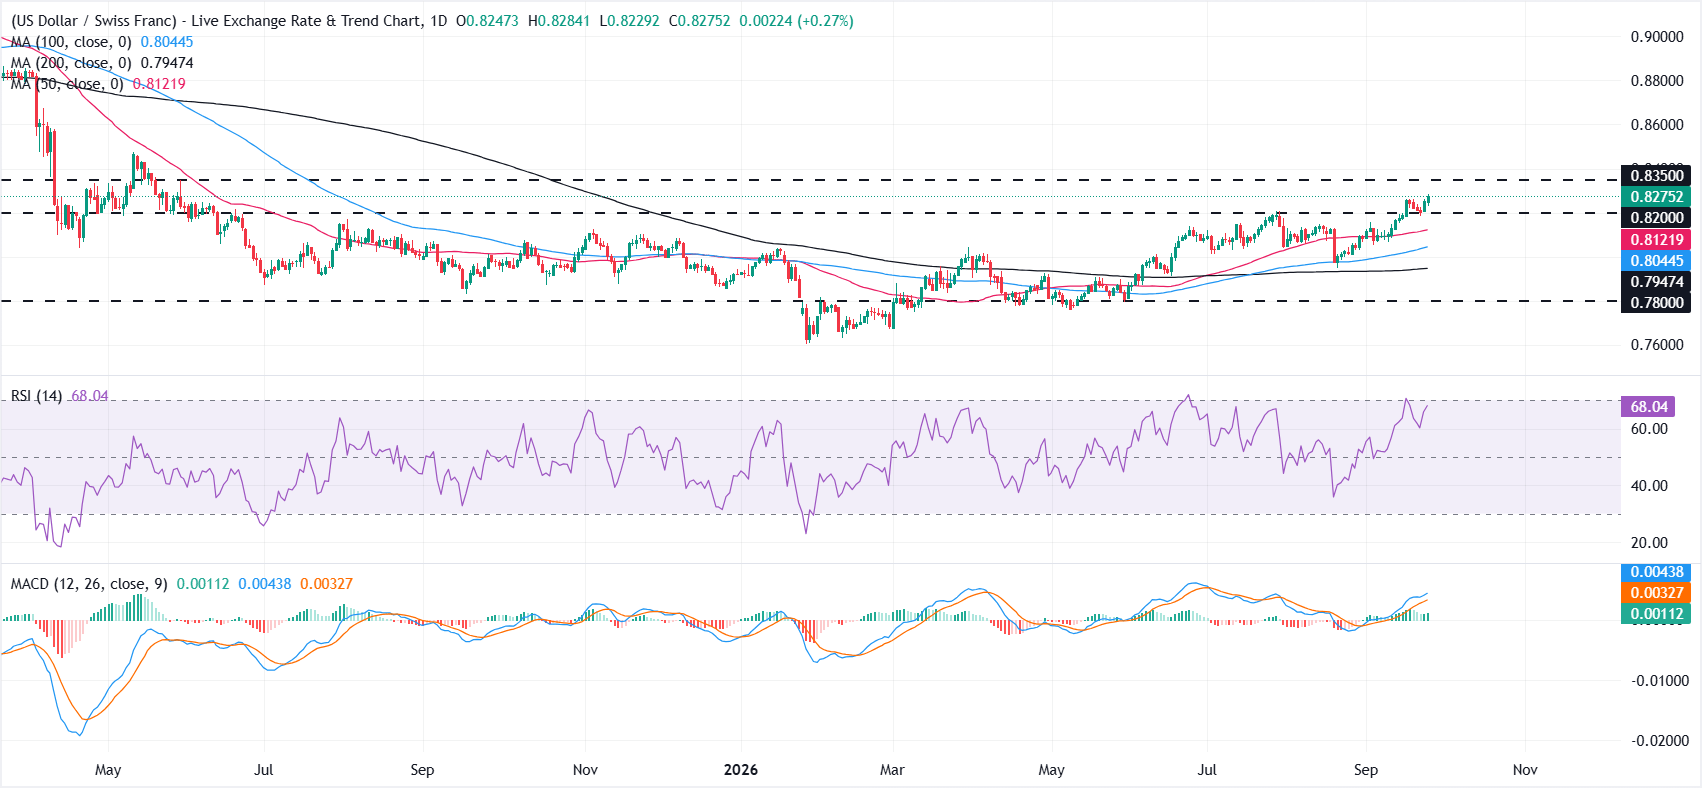
On the daily chart, USD/CHF extends its advance above the 50-day, 100-day and 200-day Simple Moving Averages (SMAs) clustered between roughly 0.8120 and 0.7950, which reinforces a bullish near-term bias.
Momentum adds to the positive tone, with the Relative Strength Index (14) hovering near 68, close to overbought territory, and the Moving Average Convergence Divergence (MACD) line holding in positive territory, hinting that upside pressure remains in place even if the rally looks stretched.
On the downside, initial support is seen at the 0.8200 horizontal level, followed by the 50-day SMA at 0.8122 and the 100-day SMA at 0.8045, before the 200-day SMA at 0.7947 and the deeper floor near 0.7800.
On the topside, immediate resistance is located at 0.8350, and a sustained break above this barrier would open the door for further gains, while failure to clear it could trigger a corrective pullback toward the mentioned support band.
(The technical analysis of this story was written with the help of an AI tool. Know more.)
Swiss Franc Price Today
The table below shows the percentage change of Swiss Franc (CHF) against listed major currencies today. Swiss Franc was the strongest against the Japanese Yen.
| USD | EUR | GBP | JPY | CAD | AUD | NZD | CHF | |
|---|---|---|---|---|---|---|---|---|
| USD | 0.13% | 0.13% | 0.27% | 0.12% | 0.16% | 0.07% | 0.28% | |
| EUR | -0.13% | -0.00% | 0.13% | -0.04% | 0.02% | -0.06% | 0.14% | |
| GBP | -0.13% | 0.00% | 0.13% | -0.03% | 0.02% | -0.07% | 0.14% | |
| JPY | -0.27% | -0.13% | -0.13% | -0.17% | -0.12% | -0.23% | -0.01% | |
| CAD | -0.12% | 0.04% | 0.03% | 0.17% | 0.05% | -0.06% | 0.16% | |
| AUD | -0.16% | -0.02% | -0.02% | 0.12% | -0.05% | -0.10% | 0.12% | |
| NZD | -0.07% | 0.06% | 0.07% | 0.23% | 0.06% | 0.10% | 0.25% | |
| CHF | -0.28% | -0.14% | -0.14% | 0.01% | -0.16% | -0.12% | -0.25% |
The heat map shows percentage changes of major currencies against each other. The base currency is picked from the left column, while the quote currency is picked from the top row. For example, if you pick the Swiss Franc from the left column and move along the horizontal line to the US Dollar, the percentage change displayed in the box will represent CHF (base)/USD (quote).
Author

Vishal Chaturvedi
FXStreet
I am a macro-focused research analyst with over four years of experience covering forex and commodities market. I enjoy breaking down complex economic trends and turning them into clear, actionable insights that help traders stay ahead of the curve.

















