- USD/CAD climbs to near 1.3800 as the US Dollar strengthens ahead of a volatile Wednesday.
- Investors will keenly focus on the Fed’s dot plot for the interest rate outlook.
- BoC Macklem may provide cues over subsequent rate cuts.
The USD/CAD pair jumps to near the round-level resistance of 1.3800 in Tuesday’s American session. The Loonie asset strengthens as the US Dollar (USD) rises to the monthly high. The US Dollar Index (DXY), which tracks the Greenback’s value against six major currencies, jumps to 105.40 as market sentiment remains risk-averse ahead of the United States (US) Consumer Price Index (CPI) data for May and the Federal Reserve’s (Fed) interest rate decision, which are scheduled for Wednesday.
The S&P 500 delivered significant losses in the opening session, exhibiting investors' weak risk appetite. Investors remain cautious ahead of the Fed’s dot-plot, which will indicate where policymakers see the Federal fund rate heading. The Fed’s decision on interest rates is widely expected to be unchanged, as inflation is far from the desired rate of 2%.
Fed officials have been advocating for maintaining the current interest rate framework for a long time until they gain greater confidence that inflation is progressively declining. Soft inflation data for three or four months could build that confidence among policymakers.
Meanwhile, the Canadian Dollar will dance to the tunes of the speech from Bank of Canada (BoC) Governor Tiff Macklem, which is scheduled for Wednesday. BoC Macklem will provide more cues about whether the central bank will announce subsequent rate cuts.
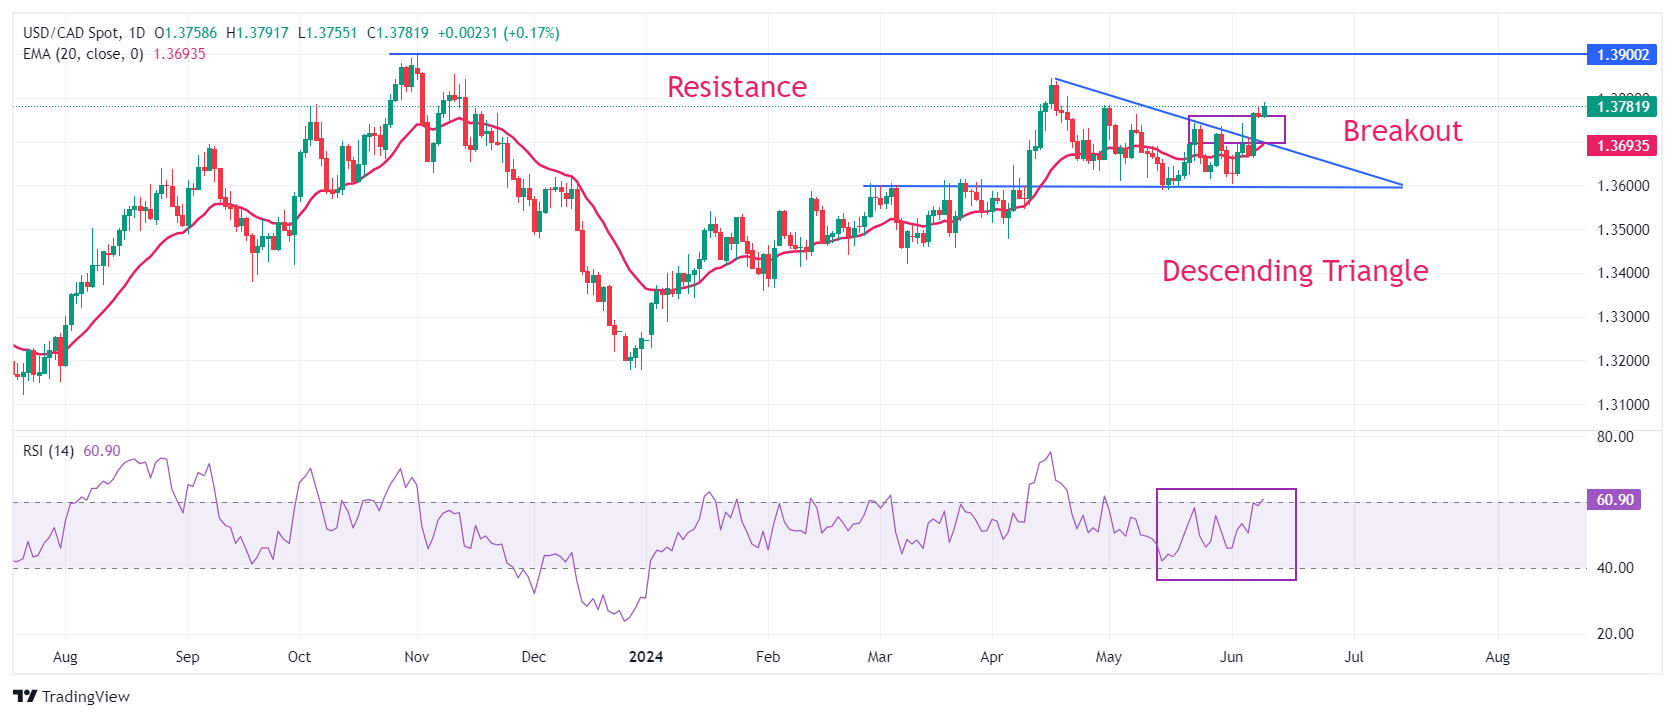
USD/CAD strengthens after a breakout of the Descending Triangle chart pattern formed on a daily timeframe. The upward-sloping 20-day Exponential Moving Average (EMA) near 1.3700 suggests that the near-term trend is bullish.
The 14-period Relative Strength Index (RSI) jumps above 60.00. A sustainable move above the same will push momentum towards the upside.
Fresh buying opportunity would emerge if the asset breaks above April 17 high at 1.3838. This would drive the asset towards 1 November 2023 high at 1.3900, followed by the psychological resistance of 1.4000.
In an alternate scenario, a breakdown below June 7 low at 1.3663 will expose the asset to May 3 low around 1.3600 and April 9 low around 1.3547.
USD/CAD daily chart
Information on these pages contains forward-looking statements that involve risks and uncertainties. Markets and instruments profiled on this page are for informational purposes only and should not in any way come across as a recommendation to buy or sell in these assets. You should do your own thorough research before making any investment decisions. FXStreet does not in any way guarantee that this information is free from mistakes, errors, or material misstatements. It also does not guarantee that this information is of a timely nature. Investing in Open Markets involves a great deal of risk, including the loss of all or a portion of your investment, as well as emotional distress. All risks, losses and costs associated with investing, including total loss of principal, are your responsibility. The views and opinions expressed in this article are those of the authors and do not necessarily reflect the official policy or position of FXStreet nor its advertisers. The author will not be held responsible for information that is found at the end of links posted on this page.
If not otherwise explicitly mentioned in the body of the article, at the time of writing, the author has no position in any stock mentioned in this article and no business relationship with any company mentioned. The author has not received compensation for writing this article, other than from FXStreet.
FXStreet and the author do not provide personalized recommendations. The author makes no representations as to the accuracy, completeness, or suitability of this information. FXStreet and the author will not be liable for any errors, omissions or any losses, injuries or damages arising from this information and its display or use. Errors and omissions excepted.
The author and FXStreet are not registered investment advisors and nothing in this article is intended to be investment advice.
Recommended content
Editors’ Picks
EUR/USD retreats to 1.0700 area following post-PCE jump

After spiking to a daily high of 1.0720 with the immediate reaction to US PCE inflation data, EUR/USD lost its traction and declined to the 1.0700 area. Investors remain cautious ahead of this weekend's French election and make it difficult for the Euro to gather strength.
GBP/USD stays below 1.2650 after US inflation data

GBP/USD struggles to preserve its bullish momentum and trades below 1.2650 in the American session on Friday. Earlier in the day, the data from the US showed that the annual core PCE inflation declined to 2.6% in May, limiting the USD's upside and helping the pair hold its ground.
Gold keeps its daily gains near $2,330 following US PCE data

Gold prices maintain their constructive bias around $2,330 after US inflation readings gauged by the PCE matched consensus in May and US yields advance slightly across the curve.
BTC struggles around the $62,000 level

Bitcoin price faces pullback resistance at the lower band of the descending wedge around $62,000. Ethereum price finds support at $3,288, the 61.8% Fibonacci retracement level. Ripple price faces resistance at $0.500, its daily resistance level.
French Elections Preview: Euro to suffer after the calm, as specter of extremists, uncertainty rise Premium

The first round of French parliamentary elections is set to trigger high uncertainty. Soothing messages from the far right and far left leave the Euro vulnerable to falls. Calm may return only after the second round of voting on July 7.