- SQ shares dropped Monday after payment provider announced acquisition of Afterpay.
- Square also released Q2 earnings on Sunday and missed revenue projections.
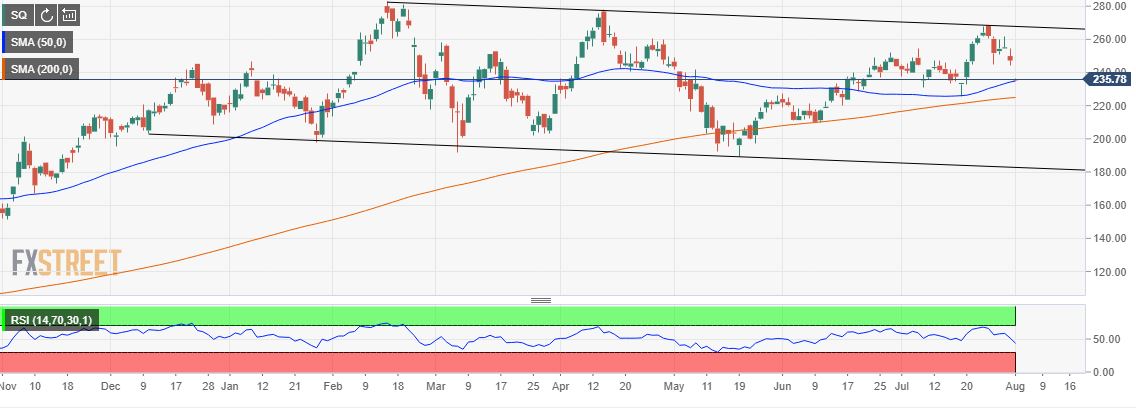
- SQ stock is trading within a descending price channel.
This is one of those days it is not hip to be Square (NYSE: SQ). Already scheduled to release second-quarter earnings this Thursday, on Sunday Square surprised pretty much everyone with both an all-stock deal to acquire Australian “buy now, pay later” firm Afterpay for $29 billion and early Q2 results. A double-whammy it was. The steep price has some formerly eager investors reeling in their rods, with the premarket sell-off reducing the SQ stock price by as much as 4.3%.
SQ news: Afterpay acquisition
Buying Afterpay would be the largest such acquisition in Australian history. Though the deal appears to be somewhat unpopular with investors, Wall Street analysts seem to resoundingly affirm the deal’s merits. UBS writes: “The implied valuation of Square's offer is materially above our price target, but is almost perfectly in line with the consensus price target (FactSet) for Afterpay of $125.99. UBS does not cover Square, though we highlight that the consensus price target for Square is $281.76.”
The acquisition, which is slated to close in the first quarter of 2022, would enable the payments innovator to integrate the “buy now, pay later” model into both its Cash App for consumers and payment platform for commercial customers. Barclays Capital was even more bullish, believing "Afterpay makes long-term fundamentals stronger, as Square inches closer to becoming the JPMorgan Chase & Co of the future.”
Many Twitter observers, however, believe the deal will stall out Square’s stock price for the time being:
1. $CRM bought $WORK - 18 months stock will go nowhere
— Mukund Mohan (@mukund) August 2, 2021
2. $TDOC buys $LVGO - 18 months stock will go nowhere
Large acquisitions take time to digest
Same for $SQ and $AFTPY I think
This stock will stay in $200 - $250 range for a while is my guess
We shall see
ht: @skaushi
SQ earnings: Misses top line, beats on bottom line
Square’s $4.68 billion in revenue was the low point of the company’s surprise Q2 earnings release. Wall Street had expected a figure closer to Q1 revenue of $5.06 billion. Earnings per share (EPS) of $0.66, however, ran laps around expectations of $0.31. EPS was up a gigantic 267% YoY on gross profit of $1.14 billion, a 91% increase.
Additionally, gross payment volume of $42.8 billion far outstripped Q1, which handled $33.1 billion in payments. This figure demonstrates that Square is both increasing payments from existing customers as well as acquiring new ones. The company invested $170 million in Bitcoin in the second quarter, on top of the $50 million it acquired in Q1. The investment suffered an impairment loss of $45 million by the end of the quarter, however.
SQ chart: Destined to trade sideways
SQ shares rose over 200% in 2020, so it is no surprise that they have used most of this year to take a breather. Year to date, the S&P 500 has returned 17% compared with SQ’s 13.6% – an unusual sign for a much-watched growth name. Square has been trading within an ever-so-slightly descending price channel since mid-February that features three tops and four bottoms. This high number of touches would appear to mean the market expects SQ to remain in a sideways range pattern for the time being. The last top on July 26 at $268.34 provides the current target for bulls. With the recent top involving a bearish engulfing candle and the premarket shedding shares after a largely positive earnings release though, the most likely near term movement is down.
The first support is the $234.25 price level where the 50-day Simple Moving Average (SMA) sits. More support can be found at the 200-day SMA at $224.93. Traders will note, however, that SQ price did not strictly respect the 200-day when it first came into contact with it back in Mid-May. At that time, the price traded $10 to $15 below for more than a week before rebounding. If it fails to provide support again, it is possible that marketwide negativity could send it down as far as the descending lower, which coincides with support from November 2020 just above $180. To reach this nadir though would require SQ price breaking through support structures at both $210 and $200 though, which most market participants may think unlikely.
.
SQ 1-day chart
Like this article? Help us with some feedback by answering this survey:
Information on these pages contains forward-looking statements that involve risks and uncertainties. Markets and instruments profiled on this page are for informational purposes only and should not in any way come across as a recommendation to buy or sell in these assets. You should do your own thorough research before making any investment decisions. FXStreet does not in any way guarantee that this information is free from mistakes, errors, or material misstatements. It also does not guarantee that this information is of a timely nature. Investing in Open Markets involves a great deal of risk, including the loss of all or a portion of your investment, as well as emotional distress. All risks, losses and costs associated with investing, including total loss of principal, are your responsibility. The views and opinions expressed in this article are those of the authors and do not necessarily reflect the official policy or position of FXStreet nor its advertisers. The author will not be held responsible for information that is found at the end of links posted on this page.
If not otherwise explicitly mentioned in the body of the article, at the time of writing, the author has no position in any stock mentioned in this article and no business relationship with any company mentioned. The author has not received compensation for writing this article, other than from FXStreet.
FXStreet and the author do not provide personalized recommendations. The author makes no representations as to the accuracy, completeness, or suitability of this information. FXStreet and the author will not be liable for any errors, omissions or any losses, injuries or damages arising from this information and its display or use. Errors and omissions excepted.
The author and FXStreet are not registered investment advisors and nothing in this article is intended to be investment advice.
Recommended content
Editors’ Picks
EUR/USD recovers to 1.0700 as US Dollar loses ground

EUR/USD recovers to test 1.0700 in the European session on Thursday. The renewed US Dollar selling in tandem with the USD/JPY retreat lends support to the pair. The pair's upside, however, appears capped amid EU political jitters. US data is next in focus.
USD/JPY holds pullback near 160.50, Japanese intervention risks loom

USD/JPY holds the pullback near 160.50 in European trading on Thursday, eroding a part of Wednesday's upsurge. The pair is dragged down by broad risk aversion and Japanese verbal intervention, supporting the Japanese Yen. The focus now is on potential FX intervention and US data.
Gold bounces off $2,300 after traders take profit

Gold bounces off the psychologically important $2,300 level after another leg of selling. The pair continues to be pressured by a higher-for-longer outlook on interest rates – data on Friday could be key.
Bitcoin extends losses after US government sends $240 million worth of BTC to Coinbase

The US Government transferred 3,940.28 BTC, valued at $241.22 million, to Coinbase Prime. The German Government transferred another 750 BTC, valued at $46.35 million, on Wednesday.
Indices fall back as inflation worries return

Higher inflation in Australia has not helped matters, and raises the uncomfortable prospect that major bugbear of the past two years is set to make an unwelcome return, leading to rate hikes once again.