S&P 500: More uncertainty following earnings, weak GDP number

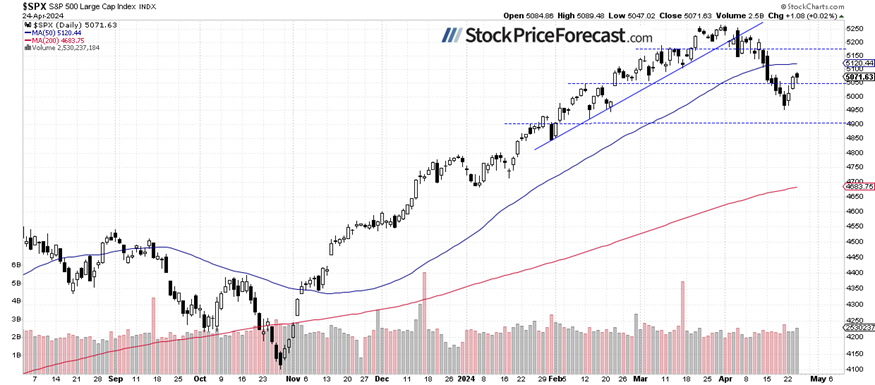
Wednesday’s trading session wasn’t a game changer as stock prices fluctuated following their Monday’s-Tuesday’s rebound. The S&P 500 index gained 0.02% after bouncing from the intraday low of around 5,050. On Friday, the index hit a new medium-term low of 4,953.56. This marked its lowest level since late February, with a decline of over 311 points or 5.9% from the record high of 5,264.85 on February 28. This week, stock prices rebounded as tensions in the Middle East somewhat eased, and investors shifted their focus to the quarterly earnings releases.
The META stock earnings release significantly worsened investors sentiment, and this morning, the futures contract is indicating a 1.0% lower opening of the trading session for the index. Additionally, the bearish case was supported by today’s Advance GDP data, which showed an increase of just 1.6% in the first quarter (vs. the expected +2.5%). Today after-hours, we will get important releases from GOOG, INTC and MSFT. Following yesterday’s reversal, the market may consolidate after last week’s sell-off.
In my Stock Price Forecast for April, I noted, “Closing the month of March with a gain of 3.1%, the question arises: Will the S&P 500 further extend the bull market in April, or is a downward correction on the horizon? From a contrarian standpoint, such a correction seems likely, but the overall trend remains bullish.”
Yesterday, the sentiment worsened again, as indicated by the AAII Investor Sentiment Survey, which showed that only 32.1% of individual investors are bullish, while 33.9% of them are bearish. The AAII sentiment is a contrary indicator in the sense that highly bullish readings may suggest excessive complacency and a lack of fear in the market. Conversely, bearish readings are favorable for market upturns.
On Friday, the market broke a significant support level, marked by the daily gap up from February 22 (4,983.21-5,038.83), but this week, it retraced some of the decline, closing above that support level on Tuesday and Wednesday, as we can see on the daily chart.
Nasdaq 100 – Uncertainty following a rebound
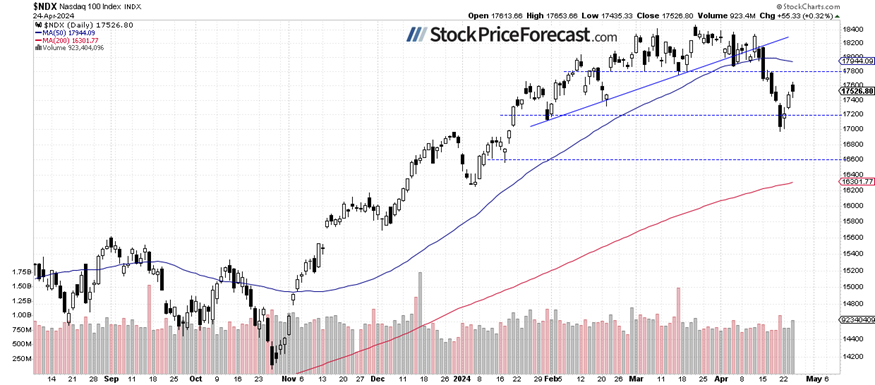
Recently, the technology-focused Nasdaq 100 index broke the 18,000 level, and on Friday, it briefly dipped below the 17,000 level, reaching a local low of 16,973.94.
Yesterday, it traded as high as 17,653.66, before closing just 0.32% higher after an intraday retreat. The resistance level remains at 17,800, marked by the previous lows. Yesterday’s META's earnings release and today’s data are expected to push the index 1.5% lower at opening.
VIX remained close to 16
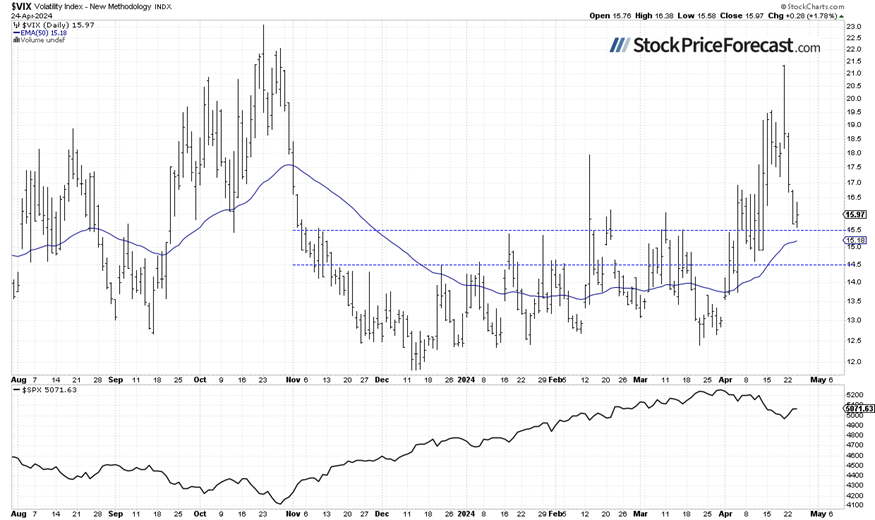
The VIX index, also known as the fear gauge, is derived from option prices. In late March, it was trading around the 13 level. However, recent market volatility has led to an increase in the VIX. On Friday, it reached a high of 21.4, the highest since late October, indicating fear in the market. This week, it has been retracing that advance, reaching below the 16 level on Tuesday and yesterday.
Historically, a dropping VIX indicates less fear in the market, and rising VIX accompanies stock market downturns. However, the lower the VIX, the higher the probability of the market’s downward reversal.
Futures contract – Below 5,100 again
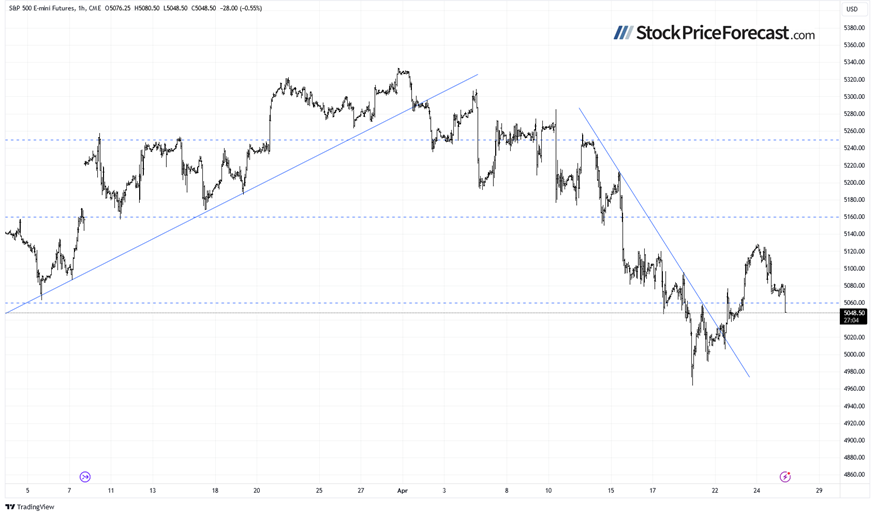
Let’s take a look at the hourly chart of the S&P 500 futures contract. Yesterday, the market reached a local high of around 5,129, which marked the highest point of the rebound. The after-hours price action pushed the contract lower, towards a support level of around 5,050-5,070. The resistance remains at around 5,100-5,120.
Conclusion
The S&P 500 index accelerated its downtrend last week, extending a correction from the March 28 record high of 5,264.85 on Middle East tensions, strong U.S. dollar. On Friday, it sold off below the important 5,000 level, and this week, it rebounded and retraced some of the declines.
However, yesterday, the S&P 500 backed off from a local high of around 5,090, and this morning, it’s poised to open 1.0% lower on yesterday’s META earnings and the likely 15% lower opening of that stock, plus a weak Advance GDP data.
Yesterday, I wrote “Was it an upward reversal? It still looks like an upward correction or consolidation following an almost 6% decline from the recently acquired new record high.
However, it might be a time for cautious optimism, as earnings releases appear to be driving stock prices higher.”
Indeed, it still looks like an upward correction, and I was right about a cautious optimism – it’s not a time to by fully optimistic about the market, which remains within a correction phase.
On April 2, I wrote that “In April, we will see a usual series of important economic data, but with the Fed leaning towards easing monetary policy, we should perhaps pay more attention to the quarterly earnings season. However, good earnings may be met with a profit-taking action this time. The market appears to be getting closer to a correction.”
Then, I added: “It appears that profit-taking is happening. Is this a new downtrend? Likely not, however, a correction towards 5,000-5,100 is possible at some point.”
For now, my short-term outlook remains neutral.
Here’s the breakdown:
-
The S&P 500 is likely to retrace some of its Tuesday’s-Wednesday’s rebound on META report, GDP data.
-
On Friday, stock prices were the lowest since February, indicating a correction of the medium-term advance.
-
In my opinion, the short-term outlook is neutral.
The full version of today’s analysis - today’s Stock Trading Alert - is bigger than what you read above, and it includes the additional analysis of the Apple (AAPL) stock and the current S&P 500 futures contract position. I encourage you to subscribe and read the details today. Stocks Trading Alerts are also a part of our Diamond Package that includes Gold Trading Alerts and Oil Trading Alerts.
Want free follow-ups to the above article and details not available to 99%+ investors? Sign up to our free newsletter today!
Want free follow-ups to the above article and details not available to 99%+ investors? Sign up to our free newsletter today!
Author

Paul Rejczak
Sunshine Profits
Paul Rejczak is a stock market strategist who has been known for the quality of his technical and fundamental analysis since the late nineties.


