Silver Price Forecast: XAG/USD remains sideways around $65, FOMC takes centre stage
- Silver price wobbles near $65.30 with FOMC minutes in focus.
- The impact of receded hawkish Fed bets has been offset by surging oil prices.
- Soft US data forces traders to pare back hawkish Fed bets.

Silver price (XAG/USD) continues to trade in a limited range at around $65.30 during the European trading session on Tuesday. The white metal has been trading sideways in a range between $63.50 and $66.80 for a week, as the impact of traders pricing out hawkish Federal Reserve (Fed) bets has been offset by de-anchored global inflation expectations on the back of disrupted energy supply.
Traders don’t expect the Fed to deliver an interest rate hike in the September policy meeting due to weak United States (US) economic data for July.
Fed hike odds fade, but upside risks linger
BNY Markets’ John Velis notes that “December rate hike expectations continue to recede this past week thanks to well-behaved inflation data and a surprise drop in consumers’ retail spending.” He points out that “current expectations for the end of the year show less than a full chance of a hike, while the very next meeting, September 16, has around 30% priced in, down from over 70% at the beginning of August.” Velis argues that this shift in pricing “reinforces our view of no moves this year,” but cautions that “there’s always a risk geopolitics will heat up further and send energy prices – and headline inflation – higher.” As a result, while BNY “continue to expect no hikes this year,” they “also continue to acknowledge that the risk is to the upside, especially with hawks on the Committee publicly pushing for hikes.”
Meanwhile, a further increase in oil prices due to the non-renewal of the US-Iran ceasefire has prompted further increases in global inflation projections. Higher energy prices prompt fears of interest rate hikes by global central banks, a scenario that diminishes the appeal of non-yielding assets, like Silver.
Going forward, the major trigger for the Silver price will be the Federal Open Market Committee (FOMC) minutes of the July policy meeting, which will be released on Wednesday.
Silver Technical Analysis
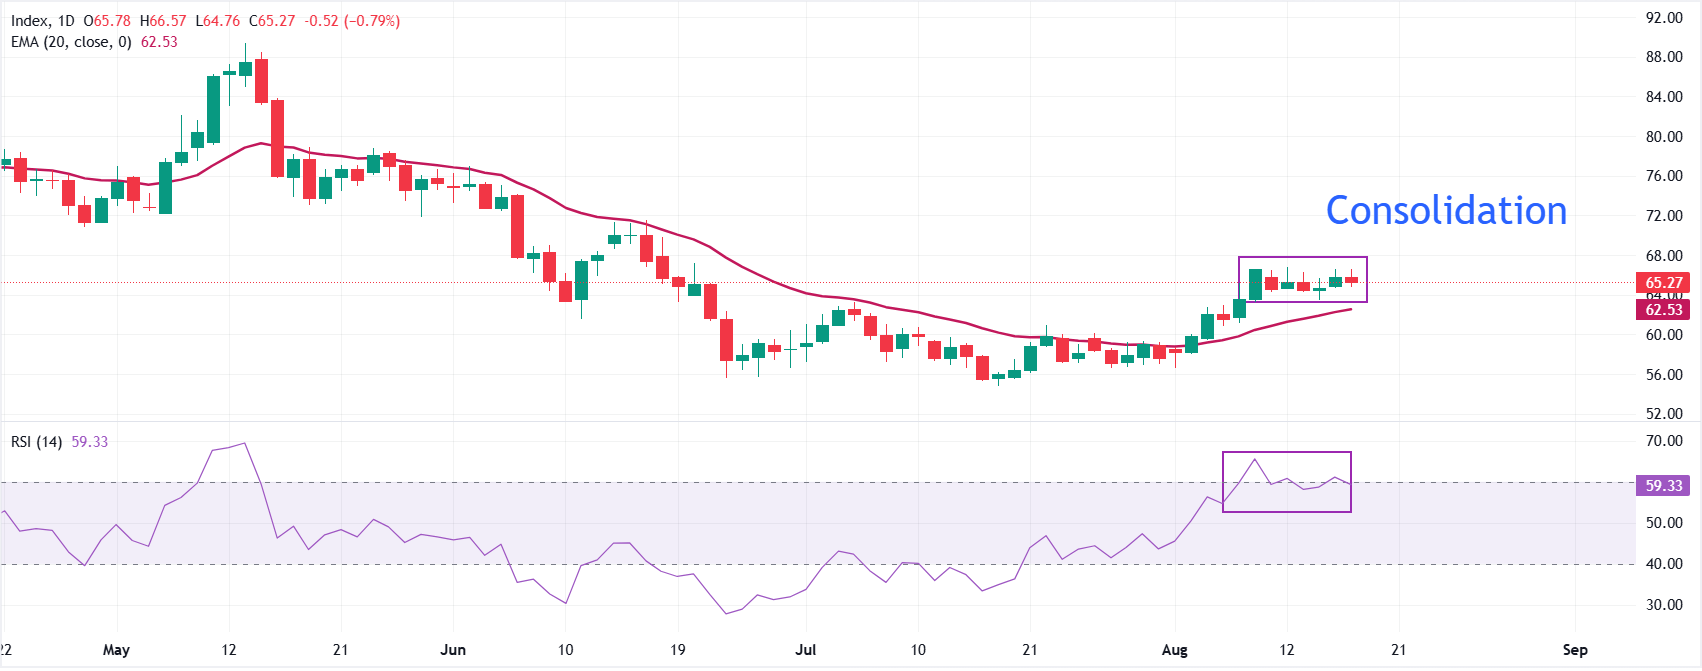
XAG/USD trades in a tight range at around $65.26 for a week. The pair holds above the 20-day Exponential Moving Average (EMA) at $62.53, keeping a constructive bullish bias as price extends away from its short-term trend base.
The Relative Strength Index (14) at 59.32 remains in positive territory but shy of overbought conditions, suggesting firm upside momentum without yet signaling exhaustion.
On the downside, immediate support is seen at the lower end of the last week's trading range near $63.50, with stronger underlying demand emerging at the 20-day EMA around $62.53. On the upside, the Silver price would see a fresh upside move towards $70.00 if it manages a decive breakout of the ongoing consolidation.
(The technical analysis of this story was written with the help of an AI tool. Know more.)
Silver FAQs
Silver is a precious metal highly traded among investors. It has been historically used as a store of value and a medium of exchange. Although less popular than Gold, traders may turn to Silver to diversify their investment portfolio, for its intrinsic value or as a potential hedge during high-inflation periods. Investors can buy physical Silver, in coins or in bars, or trade it through vehicles such as Exchange Traded Funds, which track its price on international markets.
Silver prices can move due to a wide range of factors. Geopolitical instability or fears of a deep recession can make Silver price escalate due to its safe-haven status, although to a lesser extent than Gold's. As a yieldless asset, Silver tends to rise with lower interest rates. Its moves also depend on how the US Dollar (USD) behaves as the asset is priced in dollars (XAG/USD). A strong Dollar tends to keep the price of Silver at bay, whereas a weaker Dollar is likely to propel prices up. Other factors such as investment demand, mining supply – Silver is much more abundant than Gold – and recycling rates can also affect prices.
Silver is widely used in industry, particularly in sectors such as electronics or solar energy, as it has one of the highest electric conductivity of all metals – more than Copper and Gold. A surge in demand can increase prices, while a decline tends to lower them. Dynamics in the US, Chinese and Indian economies can also contribute to price swings: for the US and particularly China, their big industrial sectors use Silver in various processes; in India, consumers’ demand for the precious metal for jewellery also plays a key role in setting prices.
Silver prices tend to follow Gold's moves. When Gold prices rise, Silver typically follows suit, as their status as safe-haven assets is similar. The Gold/Silver ratio, which shows the number of ounces of Silver needed to equal the value of one ounce of Gold, may help to determine the relative valuation between both metals. Some investors may consider a high ratio as an indicator that Silver is undervalued, or Gold is overvalued. On the contrary, a low ratio might suggest that Gold is undervalued relative to Silver.
Author

Sagar Dua
FXStreet
Sagar Dua is associated with the financial markets from his college days. Along with pursuing post-graduation in Commerce in 2014, he started his markets training with chart analysis.

















