- WTI Oil falls to around $70 on Monday in the US trading session.
- Saudi Arabia is offering discounts across the globe for its Crude selling.
- The DXY US Dollar Index holds above 102.00 as traders await US inflation figures later this week.
Oil is sliding lower towards $70, a decline by over 4% intraday. The price cut in WTI comes on the back of a price cut by Aramco in its Crude pricing for mainly Asian countries. Meanwhile the option markets sees a further swing in favor of more bearish bets on Oil prices, betting that OPEC+ will deepen current supply cuts in order to make sure Oil prices do not decline further throughout 2024.
Meanwhile, the US Dollar (USD) is paring back some losses it incurred in late December. The recovery comes on the back of the latest US jobs report, which points to a still buzzing job market, though the Institute for Supply Management numbers signalled a severe slowdown ahead. The Greenback is now getting torn between safe-haven flows on the back of rising tensions in the Middle East and the Red Sea, while the other camp is betting on swift rate cuts by the Fed to avoid a recession. With US Consumer Price Index (CPI) numbers this week, traders could possibly get reassurance whether rate cuts could be around the corner or not.
Crude Oil (WTI) trades at $70.44 per barrel, and Brent Oil trades at $75.45 per barrel at the time of writing.
Oil News and Market Movers: Saudi Arabia hits where it hurts
- Money Managers are quick to price in the current Aramco cuts, resulting in bearish bets rising in the options pricings for the first couple of expiries.
- OPEC+ leader Saudi Arabia is offering substantial cuts in its official Oil prices to Asia and other regions. For Asia specifically, prices are lowered to the lowest level since 2021.
- In a spillover effect, Oil-related stocks are sliding lower, with the Oil stock Index down 2%, the most since December 4. Shell fell as much as 2.5%, becoming the biggest loser in the Stoxx 600 Index.
- India sees a sharp ramp-up in demand for Oil products with the economy booming at a record pace. Diesel consumption is swelling by 5% compared to last year.
- Rumours in OPEC+ are pointing to some more departures of a few countries from the bloc. Countries like Gabon, Equatorial Guinea and Congo are said to be reevaluating their participation.
Oil Technical Analysis: No word on European frost and Indian pick up
Oil prices are declining this Monday on the back of Saudi Arabia offering discounts across the board. Although the initial move in Oil prices, which is down, is granted, the medium term could result in quite the opposite. With nations like India and other emerging markets reconfirming a boom in economic activity, demand is set to expand, while frost in Europe could mean ample demand is also coming back online in the Oil market.
On the upside, $74 is still holding importance, although the level has become very chopped up. Once back above this, $80 comes into the picture. Still far off, $84 is next on the topside once Oil sees a few daily closes above the $80 level.
Below $74, the $67 level could still come into play as the next support to trade at as it aligns with a triple bottom from June. Should that triple bottom break, a new low for 2023 could be close at $64.35 – the low of May and March – as the last line of defence. Although still quite far off, $57.45 is worth mentioning as the next level to keep an eye on if prices fall sharply.
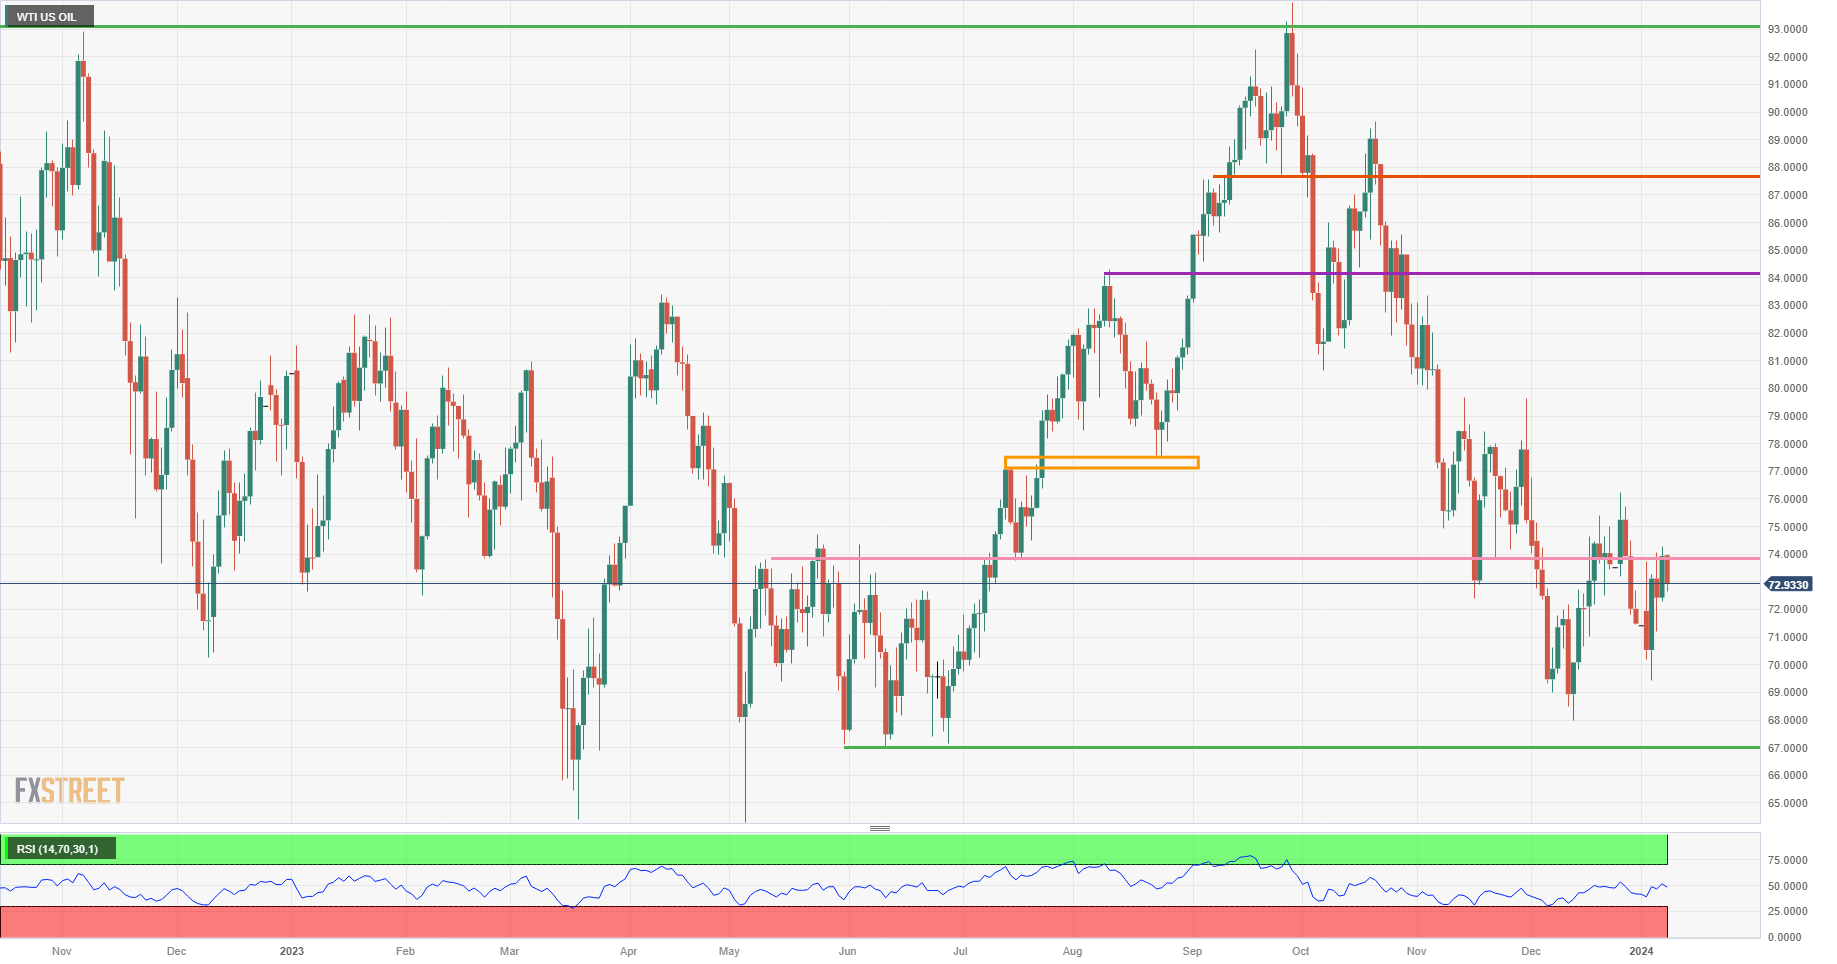
US WTI Crude Oil: Daily Chart
WTI Oil FAQs
What is WTI Oil?
WTI Oil is a type of Crude Oil sold on international markets. The WTI stands for West Texas Intermediate, one of three major types including Brent and Dubai Crude. WTI is also referred to as “light” and “sweet” because of its relatively low gravity and sulfur content respectively. It is considered a high quality Oil that is easily refined. It is sourced in the United States and distributed via the Cushing hub, which is considered “The Pipeline Crossroads of the World”. It is a benchmark for the Oil market and WTI price is frequently quoted in the media.
What factors drive the price of WTI Oil?
Like all assets, supply and demand are the key drivers of WTI Oil price. As such, global growth can be a driver of increased demand and vice versa for weak global growth. Political instability, wars, and sanctions can disrupt supply and impact prices. The decisions of OPEC, a group of major Oil-producing countries, is another key driver of price. The value of the US Dollar influences the price of WTI Crude Oil, since Oil is predominantly traded in US Dollars, thus a weaker US Dollar can make Oil more affordable and vice versa.
How does inventory data impact the price of WTI Oil
The weekly Oil inventory reports published by the American Petroleum Institute (API) and the Energy Information Agency (EIA) impact the price of WTI Oil. Changes in inventories reflect fluctuating supply and demand. If the data shows a drop in inventories it can indicate increased demand, pushing up Oil price. Higher inventories can reflect increased supply, pushing down prices. API’s report is published every Tuesday and EIA’s the day after. Their results are usually similar, falling within 1% of each other 75% of the time. The EIA data is considered more reliable, since it is a government agency.
How does OPEC influence the price of WTI Oil?
OPEC (Organization of the Petroleum Exporting Countries) is a group of 13 Oil-producing nations who collectively decide production quotas for member countries at twice-yearly meetings. Their decisions often impact WTI Oil prices. When OPEC decides to lower quotas, it can tighten supply, pushing up Oil prices. When OPEC increases production, it has the opposite effect. OPEC+ refers to an expanded group that includes ten extra non-OPEC members, the most notable of which is Russia.
Information on these pages contains forward-looking statements that involve risks and uncertainties. Markets and instruments profiled on this page are for informational purposes only and should not in any way come across as a recommendation to buy or sell in these assets. You should do your own thorough research before making any investment decisions. FXStreet does not in any way guarantee that this information is free from mistakes, errors, or material misstatements. It also does not guarantee that this information is of a timely nature. Investing in Open Markets involves a great deal of risk, including the loss of all or a portion of your investment, as well as emotional distress. All risks, losses and costs associated with investing, including total loss of principal, are your responsibility. The views and opinions expressed in this article are those of the authors and do not necessarily reflect the official policy or position of FXStreet nor its advertisers. The author will not be held responsible for information that is found at the end of links posted on this page.
If not otherwise explicitly mentioned in the body of the article, at the time of writing, the author has no position in any stock mentioned in this article and no business relationship with any company mentioned. The author has not received compensation for writing this article, other than from FXStreet.
FXStreet and the author do not provide personalized recommendations. The author makes no representations as to the accuracy, completeness, or suitability of this information. FXStreet and the author will not be liable for any errors, omissions or any losses, injuries or damages arising from this information and its display or use. Errors and omissions excepted.
The author and FXStreet are not registered investment advisors and nothing in this article is intended to be investment advice.
Recommended content
Editors’ Picks
EUR/USD retreats from daily highs, holds above 1.0800

EUR/USD loses traction but holds above 1.0800 after touching its highest level in three weeks above 1.0840. Nonfarm Payrolls in the US rose more than expected in June but downward revisions to May and April don't allow the USD to gather strength.
GBP/USD struggles to hold above 1.2800 after US jobs data

GBP/USD spiked above 1.2800 with the immediate reaction to the mixed US jobs report but retreated below this level. Nonfarm Payrolls in the US rose 206,000 in June. The Unemployment Rate ticked up to 4.1% and annual wage inflation declined to 3.9%.
Gold approaches $2,380 on robust NFP data

Gold intensifies the bullish stance for the day, rising to the vicinity of the $2,380 region following the publication of the US labour market report for the month of June. The benchmark 10-year US Treasury bond yield stays deep in the red near 4.3%, helping XAU/USD push higher.
Crypto Today: Bitcoin, Ethereum and Ripple lose key support levels, extend declines on Friday

Crypto market lost nearly 6% in market capitalization, down to $2.121 trillion. Bitcoin (BTC), Ethereum (ETH) and Ripple (XRP) erased recent gains from 2024.
French Elections Preview: Euro to “sell the fact” on a hung parliament scenario Premium

Investors expect Frances's second round of parliamentary elections to end with a hung parliament. Keeping extremists out of power is priced in and could result in profit-taking on Euro gains.