- NZD/USD falls to near 0.6130 as the New Zealand Dollar exhibits weakness ahead of the Q1 GDP data.
- The USD Index holds its immediate support of 105.00 in a holiday market mood.
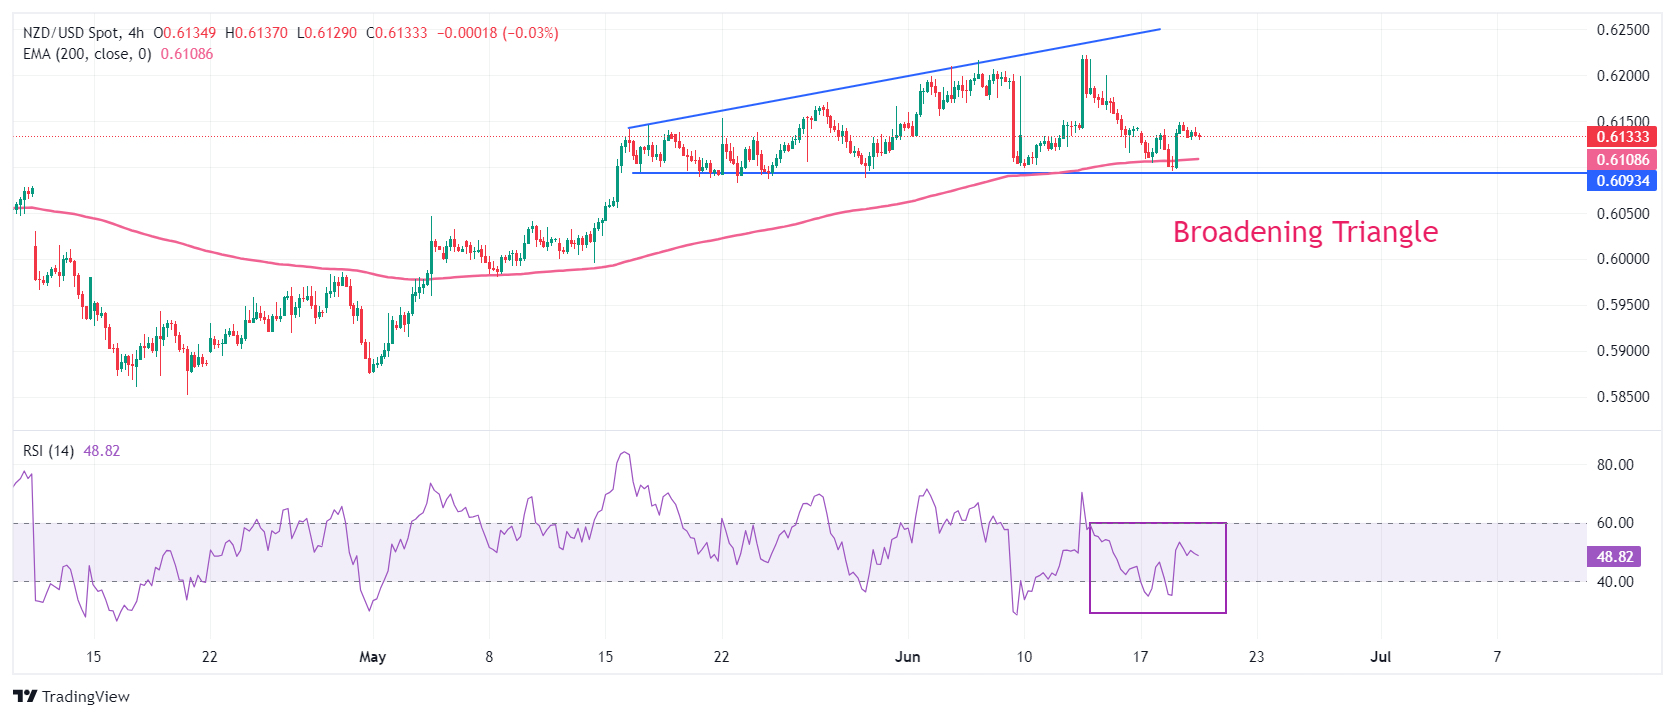
- NZD/USD declines toward the horizontal support of the Broadening Triangle pattern.
The NZD/USD pair slumps to near 0.6130 in Wednesday’s American session. The Kiwi asset drops as the New Zaland Dollar comes under pressure ahead of the New Zealand (NZ) Q1 Gross Domestic Product (GDP) data, which will be published on Thursday. The NZ economy is estimated to have remained stagnant.
Weak economic performance would boost expectations of early rate cuts by the Reserve Bank of New Zealand (RBNZ). The RBNZ has been keeping its Official Cash Rate (OCR) higher at 5.5% for more than a year due to stubborn inflationary pressures.
Meanwhile, the US Dollar (USD) edges down in a thin volume trading session due to a holiday in United States (US) markets on account of Juneteenth. The US Dollar Index (DXY) holds its crucial support of 105.00. However, the near-term outlook has become uncertain as market participants expect the Federal Reserve (Fed) to cut interest rates twice this year.
This week, the US Dollar will be guided by preliminary S&P Global PMIs for June, which will be published on Thursday. The agency is expected to show a decline in the Composite PMI due to weakness in manufacturing as well as the service sector.
NZD/USD trades in a Broadening Triangle chart pattern on a four-hour timeframe in which the downside remains cushioned with the horizontal support, which is plotted from May 16 low around 0.6100. While the upside in the above-mentioned chart formation remains limited to the upward-sloping border, which in this case is marked from May 16 high around 0.6140.
The 200-period Exponential Moving Average (EMA) near 0.6101 continues to provide support to the New Zealand Dollar bulls.
The 14-period Relative Strength index (RSI) hovers near 40.00. A break below the same will trigger a bearish momentum.
Fresh downside would appear if the asset delivers a decisive break below the round-level support of 0.6100. This would drag the asset towards April 4 high around 0.6050 and psychological support of 0.6000.
On the contrary, a reversal move above June 12 high of 0.6222, which will expose the asset January 15 high near 0.6250, followed by January 12 high near 0.6280.
NZD/USD four-hour chart
Information on these pages contains forward-looking statements that involve risks and uncertainties. Markets and instruments profiled on this page are for informational purposes only and should not in any way come across as a recommendation to buy or sell in these assets. You should do your own thorough research before making any investment decisions. FXStreet does not in any way guarantee that this information is free from mistakes, errors, or material misstatements. It also does not guarantee that this information is of a timely nature. Investing in Open Markets involves a great deal of risk, including the loss of all or a portion of your investment, as well as emotional distress. All risks, losses and costs associated with investing, including total loss of principal, are your responsibility. The views and opinions expressed in this article are those of the authors and do not necessarily reflect the official policy or position of FXStreet nor its advertisers. The author will not be held responsible for information that is found at the end of links posted on this page.
If not otherwise explicitly mentioned in the body of the article, at the time of writing, the author has no position in any stock mentioned in this article and no business relationship with any company mentioned. The author has not received compensation for writing this article, other than from FXStreet.
FXStreet and the author do not provide personalized recommendations. The author makes no representations as to the accuracy, completeness, or suitability of this information. FXStreet and the author will not be liable for any errors, omissions or any losses, injuries or damages arising from this information and its display or use. Errors and omissions excepted.
The author and FXStreet are not registered investment advisors and nothing in this article is intended to be investment advice.
Recommended content
Editors’ Picks
EUR/USD retreats to 1.0700 area following post-PCE jump

After spiking to a daily high of 1.0720 with the immediate reaction to US PCE inflation data, EUR/USD lost its traction and declined to the 1.0700 area. Investors remain cautious ahead of this weekend's French election and make it difficult for the Euro to gather strength.
GBP/USD stays below 1.2650 after US inflation data

GBP/USD struggles to preserve its bullish momentum and trades below 1.2650 in the American session on Friday. Earlier in the day, the data from the US showed that the annual core PCE inflation declined to 2.6% in May, limiting the USD's upside and helping the pair hold its ground.
Gold keeps its daily gains near $2,330 following US PCE data

Gold prices maintain their constructive bias around $2,330 after US inflation readings gauged by the PCE matched consensus in May and US yields advance slightly across the curve.
BTC struggles around the $62,000 level

Bitcoin price faces pullback resistance at the lower band of the descending wedge around $62,000. Ethereum price finds support at $3,288, the 61.8% Fibonacci retracement level. Ripple price faces resistance at $0.500, its daily resistance level.
French Elections Preview: Euro to suffer after the calm, as specter of extremists, uncertainty rise Premium

The first round of French parliamentary elections is set to trigger high uncertainty. Soothing messages from the far right and far left leave the Euro vulnerable to falls. Calm may return only after the second round of voting on July 7.