- NZD/USD clings to gains near 0.6200 ahead of US NFP report for May.
- The US Employment data will influence Fed rate-cut bets for September.
- The New Zealand Dollar strengthens amid speculation that the RBNZ will start reducing interest rates next year.
The NZD/USD pair trades inside Thursday’s trading range in Friday’s European session. The Kiwi asset clings to gains near the round-level resistance of 0.6200 amid hopes of interest rate differentials as the Reserve Bank of New Zealand (RBNZ) is expected to keep interest rates steady for the entire year while the Federal Reserve (Fed) is expected to deliver two rate cuts. Investors expect that the September meeting will be the earliest point from which the Fed will commence its policy normalization process.
The New Zealand Dollar has also capitalized on cheerful market mood. However, the market sentiment could become uncertain after the release of the United States (US) Nonfarm Payrolls (NFP) report for May, which will be published at 12:30 GMT. The US NFP report is expected to show that 185K fresh payrolls were added by employers, which were higher than the prior release of 185K.
Investors will also pay attention to the Average Hourly Earnings data for May, which exhibits the pace of the wage growth momentum. Annually, Average Hourly Earnings are estimated to have grown steadily by 3.9%. The US official Employment data that reflects country’s labor market health will significantly influence expectations for Fed interest-rate cuts in September.
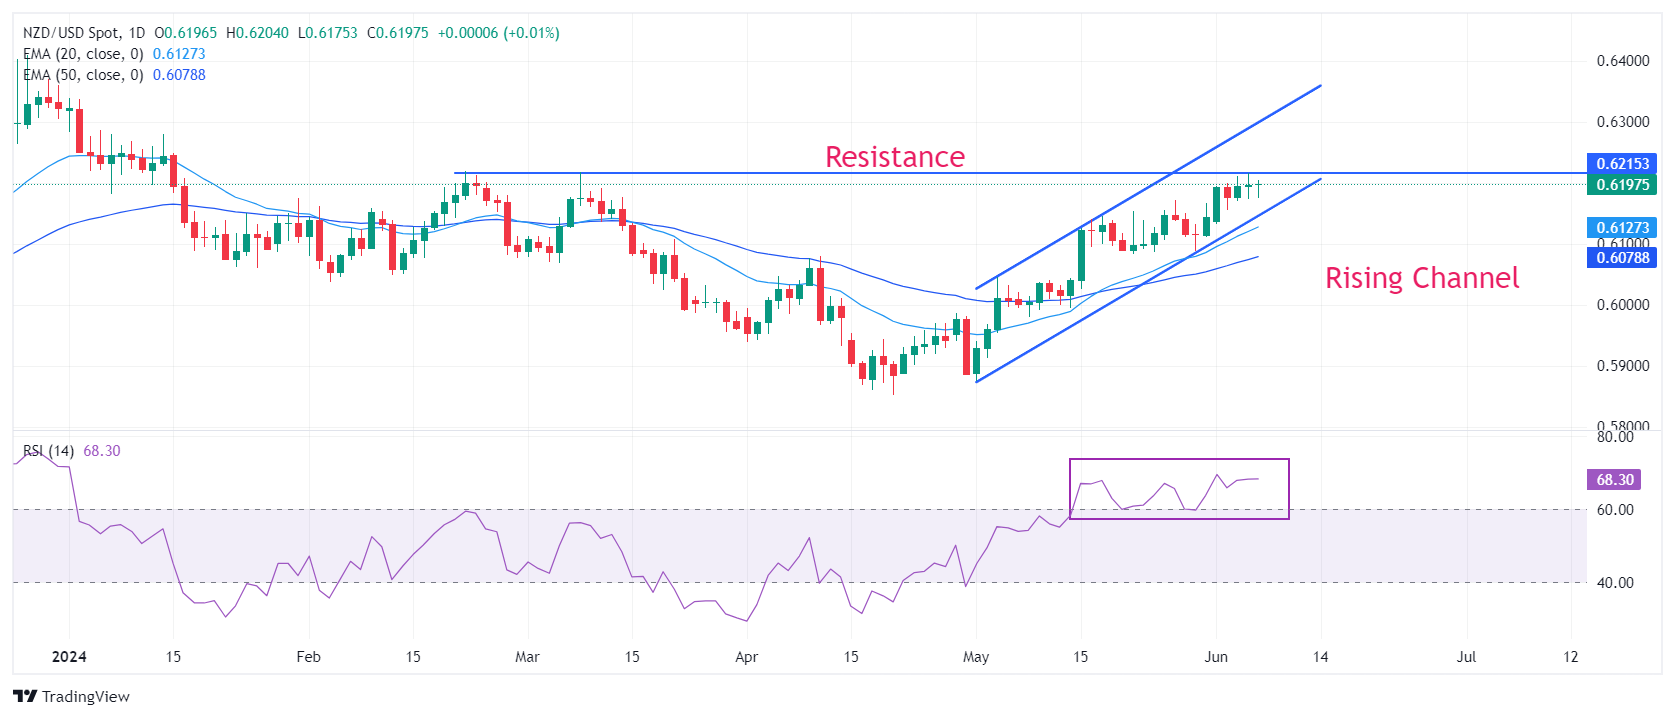
NZD/USD rises to the horizontal resistance plotted from February 22 high at 0.6219. The Kiwi asset trades in a Rising Channel chart pattern in which each pullback is considered as buying opportunity by market participants. Upward-sloping 20-and 50-day Exponential Moving Averages (EMAs) near 0.6127 and 0.6079, respectively, suggest that the overall trend is quite bullish.
The 14-period Relative Strength Index (RSI) oscillates in the bullish range of 60.00-80.00, which indicates that momentum has leaned towards the upside.
An upside move above June 6 high at 0.6216 will drive the asset January 15 high near 0.6250, followed by January 12 high near 0.6280.
On the contrary, fresh downside would appear if the asset breaks below April 4 high around 0.6050. This would drag the asset towards the psychological support of 0.6000 and April 25 high at 0.5969.
NZD/USD daily chart
Information on these pages contains forward-looking statements that involve risks and uncertainties. Markets and instruments profiled on this page are for informational purposes only and should not in any way come across as a recommendation to buy or sell in these assets. You should do your own thorough research before making any investment decisions. FXStreet does not in any way guarantee that this information is free from mistakes, errors, or material misstatements. It also does not guarantee that this information is of a timely nature. Investing in Open Markets involves a great deal of risk, including the loss of all or a portion of your investment, as well as emotional distress. All risks, losses and costs associated with investing, including total loss of principal, are your responsibility. The views and opinions expressed in this article are those of the authors and do not necessarily reflect the official policy or position of FXStreet nor its advertisers. The author will not be held responsible for information that is found at the end of links posted on this page.
If not otherwise explicitly mentioned in the body of the article, at the time of writing, the author has no position in any stock mentioned in this article and no business relationship with any company mentioned. The author has not received compensation for writing this article, other than from FXStreet.
FXStreet and the author do not provide personalized recommendations. The author makes no representations as to the accuracy, completeness, or suitability of this information. FXStreet and the author will not be liable for any errors, omissions or any losses, injuries or damages arising from this information and its display or use. Errors and omissions excepted.
The author and FXStreet are not registered investment advisors and nothing in this article is intended to be investment advice.
Recommended content
Editors’ Picks
EUR/USD retreats to 1.0700 area following post-PCE jump

After spiking to a daily high of 1.0720 with the immediate reaction to US PCE inflation data, EUR/USD lost its traction and declined to the 1.0700 area. Investors remain cautious ahead of this weekend's French election and make it difficult for the Euro to gather strength.
GBP/USD stays below 1.2650 after US inflation data

GBP/USD struggles to preserve its bullish momentum and trades below 1.2650 in the American session on Friday. Earlier in the day, the data from the US showed that the annual core PCE inflation declined to 2.6% in May, limiting the USD's upside and helping the pair hold its ground.
Gold keeps its daily gains near $2,330 following US PCE data

Gold prices maintain their constructive bias around $2,330 after US inflation readings gauged by the PCE matched consensus in May and US yields advance slightly across the curve.
BTC struggles around the $62,000 level

Bitcoin price faces pullback resistance at the lower band of the descending wedge around $62,000. Ethereum price finds support at $3,288, the 61.8% Fibonacci retracement level. Ripple price faces resistance at $0.500, its daily resistance level.
French Elections Preview: Euro to suffer after the calm, as specter of extremists, uncertainty rise Premium

The first round of French parliamentary elections is set to trigger high uncertainty. Soothing messages from the far right and far left leave the Euro vulnerable to falls. Calm may return only after the second round of voting on July 7.