- The NZD/USD slips further below the 20-day SMA as bears reinforce their strength.
- Daily chart indicators suggest an ongoing consolidation phase, marked by a slight negative momentum following last Wednesday’s push.
- The pair fell to a low of 0.6105 but bulls managed to clear most of its losses.
The NZD/USD continued its descent on Monday, moving below the 20-day Simple Moving Average (SMA) of 0.6140 the buyers managed to clear most of its daily losses. The pair seems to be stuck in a state of consolidation following the sharp surge last week to 0.6220. Despite buyers' attempts, the 20-day SMA could not be sustained, and losses could potentially extend if this trend continues.
Meanwhile, on the daily chart, the Relative Strength Index (RSI) has maintained its negative momentum, suggesting a faltering buying pressure. The downward orientation of the RSI is consistent with the flat red bars displayed by the Moving Average Convergence Divergence (MACD), further emphasizing the ongoing consolidation narrative.
NZD/USD daily chart
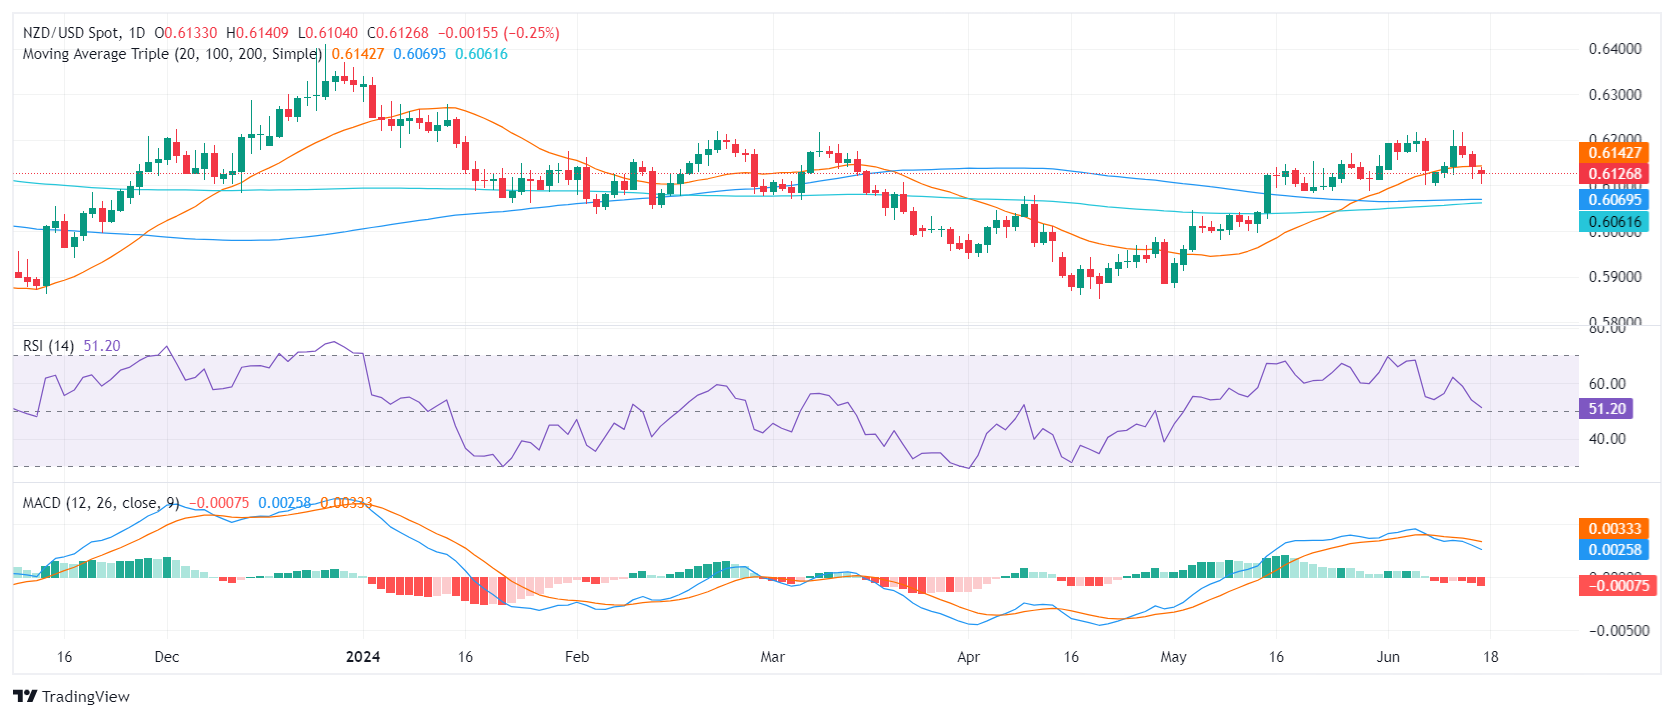
The NZD/USD's immediate resistance level stands at the 20-day SMA of 0.6140. Simultaneously, the convergence of the 100 and 200-day SMAs in the 0.6050-0.6060 region builds a sturdy support base for the pair, which is likely to aid in correction should the bears seize control. Movements below this convergence point could indicate sell conditions.
Furthermore, the main resistance continues to stand at the 0.6200 level. A breach at this point could be viewed as a buy signal, signaling an overturn of the bearish sentiment.
Information on these pages contains forward-looking statements that involve risks and uncertainties. Markets and instruments profiled on this page are for informational purposes only and should not in any way come across as a recommendation to buy or sell in these assets. You should do your own thorough research before making any investment decisions. FXStreet does not in any way guarantee that this information is free from mistakes, errors, or material misstatements. It also does not guarantee that this information is of a timely nature. Investing in Open Markets involves a great deal of risk, including the loss of all or a portion of your investment, as well as emotional distress. All risks, losses and costs associated with investing, including total loss of principal, are your responsibility. The views and opinions expressed in this article are those of the authors and do not necessarily reflect the official policy or position of FXStreet nor its advertisers. The author will not be held responsible for information that is found at the end of links posted on this page.
If not otherwise explicitly mentioned in the body of the article, at the time of writing, the author has no position in any stock mentioned in this article and no business relationship with any company mentioned. The author has not received compensation for writing this article, other than from FXStreet.
FXStreet and the author do not provide personalized recommendations. The author makes no representations as to the accuracy, completeness, or suitability of this information. FXStreet and the author will not be liable for any errors, omissions or any losses, injuries or damages arising from this information and its display or use. Errors and omissions excepted.
The author and FXStreet are not registered investment advisors and nothing in this article is intended to be investment advice.
Recommended content
Editors’ Picks
EUR/USD retreats to 1.0700 area following post-PCE jump

After spiking to a daily high of 1.0720 with the immediate reaction to US PCE inflation data, EUR/USD lost its traction and declined to the 1.0700 area. Investors remain cautious ahead of this weekend's French election and make it difficult for the Euro to gather strength.
GBP/USD stays below 1.2650 after US inflation data

GBP/USD struggles to preserve its bullish momentum and trades below 1.2650 in the American session on Friday. Earlier in the day, the data from the US showed that the annual core PCE inflation declined to 2.6% in May, limiting the USD's upside and helping the pair hold its ground.
Gold keeps its daily gains near $2,330 following US PCE data

Gold prices maintain their constructive bias around $2,330 after US inflation readings gauged by the PCE matched consensus in May and US yields advance slightly across the curve.
BTC struggles around the $62,000 level

Bitcoin price faces pullback resistance at the lower band of the descending wedge around $62,000. Ethereum price finds support at $3,288, the 61.8% Fibonacci retracement level. Ripple price faces resistance at $0.500, its daily resistance level.
French Elections Preview: Euro to suffer after the calm, as specter of extremists, uncertainty rise Premium

The first round of French parliamentary elections is set to trigger high uncertainty. Soothing messages from the far right and far left leave the Euro vulnerable to falls. Calm may return only after the second round of voting on July 7.