- NZD/USD jumps to 0.6815 after downbeat US ISM Manufacturing PMI report.
- Weak factory activity report dents the US Dollar’s appeal.
- The RBNZ is less likely to return to the policy normalization process this year.
The NZD/USD pair advances to 0.6185 in Monday’s American session as the United States (US) Institute of Supply Management (ISM) has reported a weak Manufacturing PMI report for May. The agency reported that the Manufacturing PMI, which gauges the factory activity, surprisingly declines to 48.7 from the estimates of 49.8 and the former release of 49.2.
Apart from that, other sub-components such as New Orders and Prices Paid Indexes were also weaker than expectations, weighing on the US Dollar (USD). Weak factory data is expected to boost market speculation for the Federal Reserve (Fed) to begin reducing interest rates from the September meeting. The US Dollar Index (DXY) slumps to 104.25.
Meanwhile, the New Zealand Dollar remains firm as investors expect that the Reserve Bank of New Zealand (RBNZ) will not consider lowering interest rates this year. Also, there is a debate that the RBNZ could hike its Official Cash Rate further. Meanwhile, RBNZ Governor Adrian Orr has already commented that more rate hikes remain off the table as long as inflation expectations remain anchored.
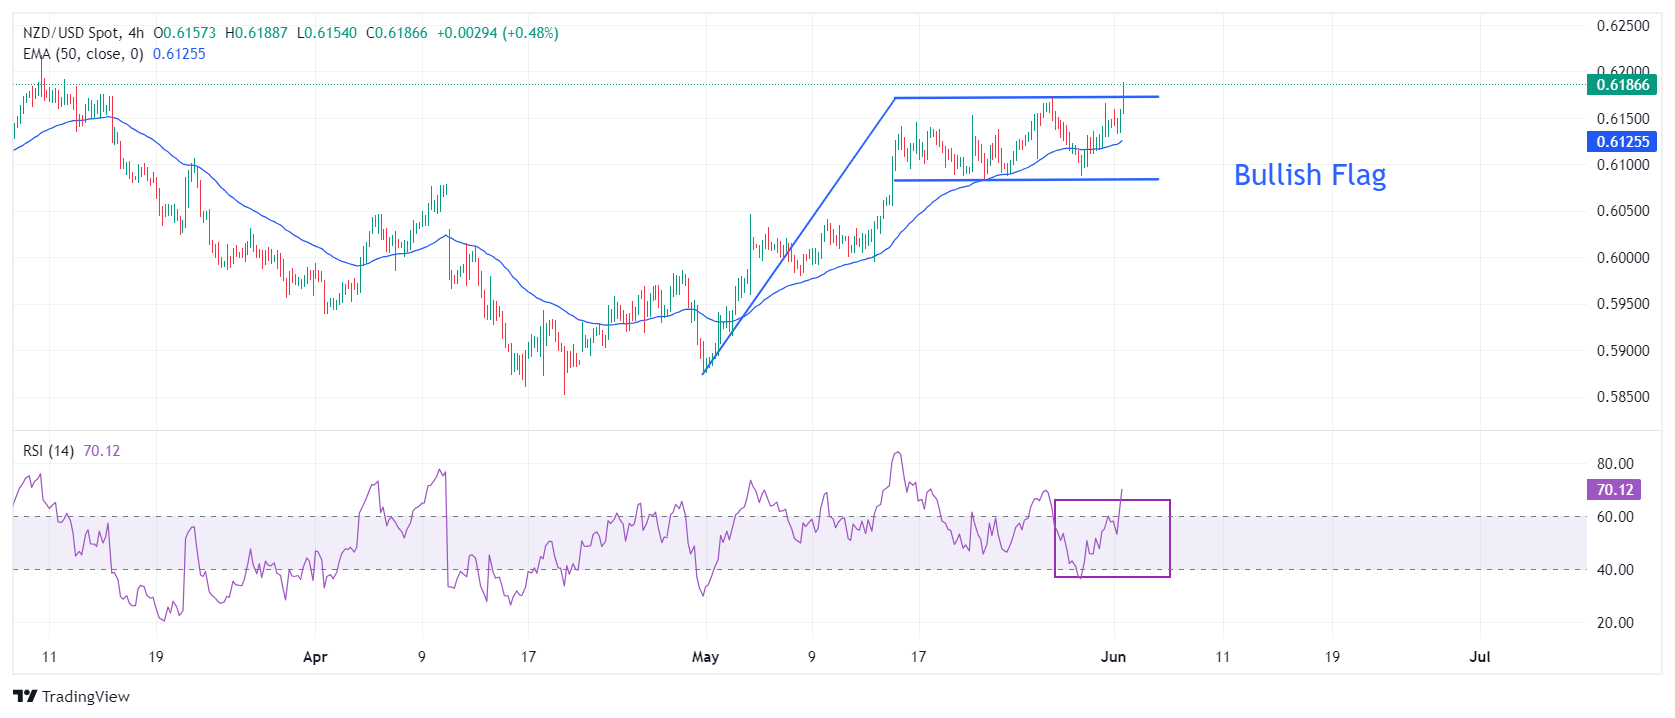
NZD/USD attempts to break the Bullish Flag chart formation in a four-hour timeframe, which exhibits an inventory adjustment process between institutional investors and retail participants. This pattern indicates a consolidation after a sharp upside move and it generally breaks towards the direction of the trend, which in this is upwards.
The 50-period Exponential Moving Average (EMA) near 0.6126 continues to provide support to the New Zealand Dollar bulls.
Meanwhile, the 14-period Relative Strength Index (RSI) has climbed above 60.00. A sustainable move above 60.00 will strengthen Kiwi bulls further.
An upside move above the round-level resistance of 0.6200 will drive the asset January 15 high near 0.6250, followed by January 12 high near 0.6280.
On the contrary, fresh downside would appear if the asset breaks below April 4 high around 0.6050 This would drag the asset towards the psychological support of 0.6000 and April 25 high at 0.5969.
NZD/USD daily chart
Information on these pages contains forward-looking statements that involve risks and uncertainties. Markets and instruments profiled on this page are for informational purposes only and should not in any way come across as a recommendation to buy or sell in these assets. You should do your own thorough research before making any investment decisions. FXStreet does not in any way guarantee that this information is free from mistakes, errors, or material misstatements. It also does not guarantee that this information is of a timely nature. Investing in Open Markets involves a great deal of risk, including the loss of all or a portion of your investment, as well as emotional distress. All risks, losses and costs associated with investing, including total loss of principal, are your responsibility. The views and opinions expressed in this article are those of the authors and do not necessarily reflect the official policy or position of FXStreet nor its advertisers. The author will not be held responsible for information that is found at the end of links posted on this page.
If not otherwise explicitly mentioned in the body of the article, at the time of writing, the author has no position in any stock mentioned in this article and no business relationship with any company mentioned. The author has not received compensation for writing this article, other than from FXStreet.
FXStreet and the author do not provide personalized recommendations. The author makes no representations as to the accuracy, completeness, or suitability of this information. FXStreet and the author will not be liable for any errors, omissions or any losses, injuries or damages arising from this information and its display or use. Errors and omissions excepted.
The author and FXStreet are not registered investment advisors and nothing in this article is intended to be investment advice.
Recommended content
Editors’ Picks
EUR/USD retreats to 1.0700 area following post-PCE jump

After spiking to a daily high of 1.0720 with the immediate reaction to US PCE inflation data, EUR/USD lost its traction and declined to the 1.0700 area. Investors remain cautious ahead of this weekend's French election and make it difficult for the Euro to gather strength.
GBP/USD stays below 1.2650 after US inflation data

GBP/USD struggles to preserve its bullish momentum and trades below 1.2650 in the American session on Friday. Earlier in the day, the data from the US showed that the annual core PCE inflation declined to 2.6% in May, limiting the USD's upside and helping the pair hold its ground.
Gold keeps its daily gains near $2,330 following US PCE data

Gold prices maintain their constructive bias around $2,330 after US inflation readings gauged by the PCE matched consensus in May and US yields advance slightly across the curve.
BTC struggles around the $62,000 level

Bitcoin price faces pullback resistance at the lower band of the descending wedge around $62,000. Ethereum price finds support at $3,288, the 61.8% Fibonacci retracement level. Ripple price faces resistance at $0.500, its daily resistance level.
French Elections Preview: Euro to suffer after the calm, as specter of extremists, uncertainty rise Premium

The first round of French parliamentary elections is set to trigger high uncertainty. Soothing messages from the far right and far left leave the Euro vulnerable to falls. Calm may return only after the second round of voting on July 7.