- Natural Gas prices take a turn for the worse and fall lower.
- Meanwhile the option markets were flashing red warning signs of overheating.
- The US Dollar Index jumps higher on Tuesday on safe-haven inflow after it sank on Monday.
Natural Gas price (XNG/USD) is giving up earlier gains and drops by 1% at the start of the US session on Tuesday after a more than 6% surge on Monday on reports that Norway was facing delivery issues in its Gas supply to Europe. Gas prices shot higher after the news amidst the refueling season for Europe ahead of next fall and winter. However, some headwinds are emerging for an extension of that rally with the options markets tilted to an overstretched long position, which might get set to become unwinded for profit-taking.
Meanwhile, the US Dollar Index (DXY), which tracks the Greenback’s value against six major currencies, is facing a volatile week. The sharp fall on Monday resulted from a mixed and overall weaker data release from the Institute for Supply Management (ISM), which confirmed again that the US manufacturing activity is retreating from its peak performance. However, the DXY soars on Tuesday, bouncing off its weekly lows, with markets fleeing to risk-off mode as equity markets plunge lower.
Natural Gas is trading at $2.72 per MMBtu at the time of writing.
Natural Gas news and market movers: Correction underway
- More confirmation hits the wires that the outage in Norway will more than definitly will get resolved by the end of this week, triggering a drop in European gas prices.
- Recent futures data reveals that Hedge Funds have extended their net-long positions in European Dutch TTF Gas futures to the highest level since October, Bloomberg Intelligence reports.
- Norwegian Gas network operator Gassco reports on its website that the unplanned Nyhamna outage will be extended until at least Friday to get the processing plant back online.
- TotalEnergies has signed two new medium- and long-term contracts for the Asian markets, amassing 1,300,000 tonnes per year of Liquefied Natural Gas (LNG), according to news website Tank Storage.
Natural Gas Technical Analysis: Profit taking with risk off taking over
Natural Gas has pulled off a very nice technical pattern by bouncing off the 200-day Simple Moving Average (SMA), near $2.53. Although it looks tempting to stick on the trade towards $3.07, the market positioning must not be overlooked. Futures data reveals that long positions are getting too crowded, which could drive a correction with traders unwinding their positions and cashing in on their gains in the near future, while Europe is in a good position to get fully refueled ahead of the next heating season.
The $3.00 marker as a big figure was tested in May. The pivotal level near $3.07 ( March 6, 2023, high) remains key as prices failed to post a daily close above it. Further up, the fresh year-to-date high at $3.16 is the level to beat.
On the downside, the 200-day Simple Moving Average (SMA) acts as the first support near $2.53. Should that support area fail to hold, the next target could be the pivotal level near $2.14, with interim support by the 55-day SMA near $2.24. Further down, the biggest support comes at $2.11 with the 100-day SMA.
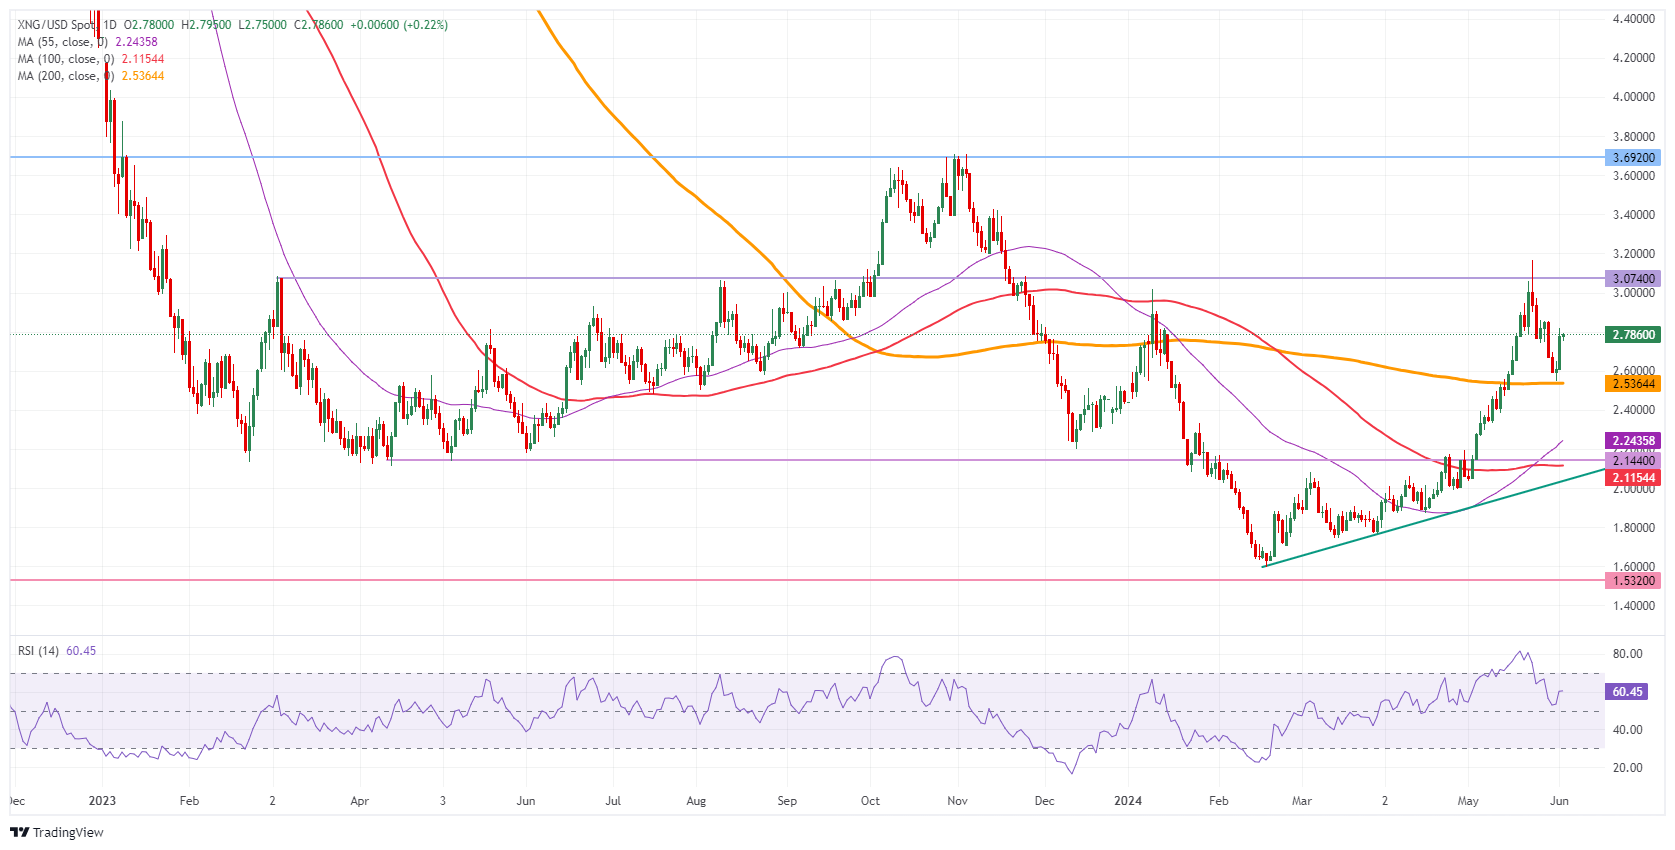
Natural Gas: Daily Chart
Natural Gas FAQs
Supply and demand dynamics are a key factor influencing Natural Gas prices, and are themselves influenced by global economic growth, industrial activity, population growth, production levels, and inventories. The weather impacts Natural Gas prices because more Gas is used during cold winters and hot summers for heating and cooling. Competition from other energy sources impacts prices as consumers may switch to cheaper sources. Geopolitical events are factors as exemplified by the war in Ukraine. Government policies relating to extraction, transportation, and environmental issues also impact prices.
The main economic release influencing Natural Gas prices is the weekly inventory bulletin from the Energy Information Administration (EIA), a US government agency that produces US gas market data. The EIA Gas bulletin usually comes out on Thursday at 14:30 GMT, a day after the EIA publishes its weekly Oil bulletin. Economic data from large consumers of Natural Gas can impact supply and demand, the largest of which include China, Germany and Japan. Natural Gas is primarily priced and traded in US Dollars, thus economic releases impacting the US Dollar are also factors.
The US Dollar is the world’s reserve currency and most commodities, including Natural Gas are priced and traded on international markets in US Dollars. As such, the value of the US Dollar is a factor in the price of Natural Gas, because if the Dollar strengthens it means less Dollars are required to buy the same volume of Gas (the price falls), and vice versa if USD strengthens.
Information on these pages contains forward-looking statements that involve risks and uncertainties. Markets and instruments profiled on this page are for informational purposes only and should not in any way come across as a recommendation to buy or sell in these assets. You should do your own thorough research before making any investment decisions. FXStreet does not in any way guarantee that this information is free from mistakes, errors, or material misstatements. It also does not guarantee that this information is of a timely nature. Investing in Open Markets involves a great deal of risk, including the loss of all or a portion of your investment, as well as emotional distress. All risks, losses and costs associated with investing, including total loss of principal, are your responsibility. The views and opinions expressed in this article are those of the authors and do not necessarily reflect the official policy or position of FXStreet nor its advertisers. The author will not be held responsible for information that is found at the end of links posted on this page.
If not otherwise explicitly mentioned in the body of the article, at the time of writing, the author has no position in any stock mentioned in this article and no business relationship with any company mentioned. The author has not received compensation for writing this article, other than from FXStreet.
FXStreet and the author do not provide personalized recommendations. The author makes no representations as to the accuracy, completeness, or suitability of this information. FXStreet and the author will not be liable for any errors, omissions or any losses, injuries or damages arising from this information and its display or use. Errors and omissions excepted.
The author and FXStreet are not registered investment advisors and nothing in this article is intended to be investment advice.
Recommended content
Editors’ Picks
AUD/USD stands tall just below its highest level since January touched on Wednesday

The AUD/USD pair holds above the 0.6700 mark during the Asian session on Thursday. The Australian Dollar continues to draw support from the upbeat domestic Retail Sales data released on Wednesday, which strengthened the case for a rate hike by the Reserve Bank of Australia.
EUR/USD lurches higher after US data dumps Greenback

EUR/USD found a leg up on Wednesday, climbing briefly above the 1.0800 handle after a broad miss in US economic figures hinted at further signs of a weakening US economy, sparking fresh hopes for an accelerated pace of rate cuts from the Federal Reserve and markets flowing out of the safe haven US Dollar.
Gold reaches $2,360 on broad USD weakness

Gold gathers bullish momentum and trades at its highest level in nearly two weeks above $2,360. Following the disappointing ADP Employment Change and ISM Services PMI data from the US, the 10-year US yield declines sharply, helping XAU/USD extend its daily rally.
PolitiFi meme coins surge as Biden support lowers

Several political meme coins related to Vice President Kamala Harris rallied on Wednesday as prediction market odds favor her as the preferred Democrat nominee in the upcoming US presidential race.
Could the post-UK elections market moves resemble 1997 and 2010?

Thursday's UK elections expected to bring political change. Similar developments in both 1997 and 2010 weighed on the Pound. History points to a significant easing in Pound volatility across the board. Recent FTSE 100 performance matches the 2015 pre-election moves.