![]() Elliott Wave Forecast Team
Elliott Wave Forecast Team
ElliottWave-Forecast.com
Johnson & Johnson (JNJ) is an American multinational corporation founded in 1886 that develops medical devices, pharmaceuticals, and consumer packaged goods. Its common stock is a component of the Dow Jones Industrial Average, and the company is ranked No. 36 on the 2021 Fortune 500 list of the largest United States corporations by total revenue.
JNJ daily chart February 2024
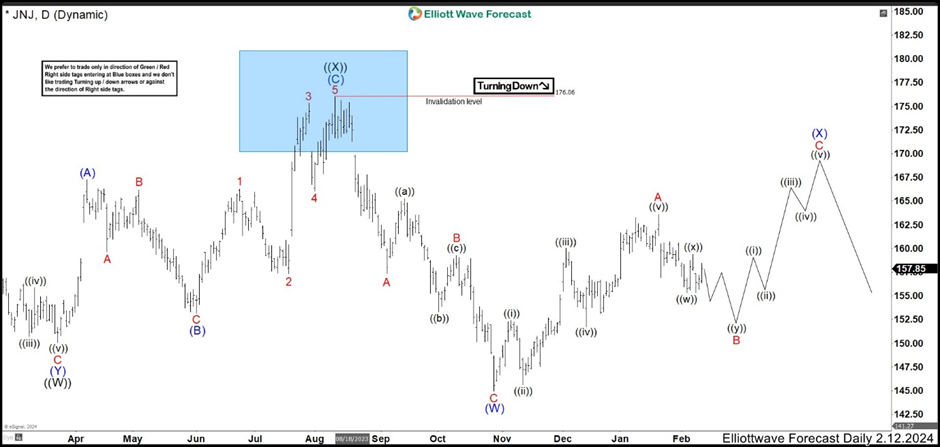
In the last analysis, we called 3 waves more to the downside to end a double correction structure ((W)), ((X)), ((Y)). The stock reacted lower from a blue box area ending wave ((X)) and starting wave ((Y)). First leg of wave ((Y)) did 3 swings, with a wave B as a flat correction, ending wave (W) at 144.95 low. Then, we were looking for 3 swings higher to fail below 175.97 high to complete wave (X) before seeing lower prices. (If you want to learn more about Elliott Wave Theory, please follow these links: Elliott Wave Education and Elliott Wave Theory).
JNJ weekly chart June 2024
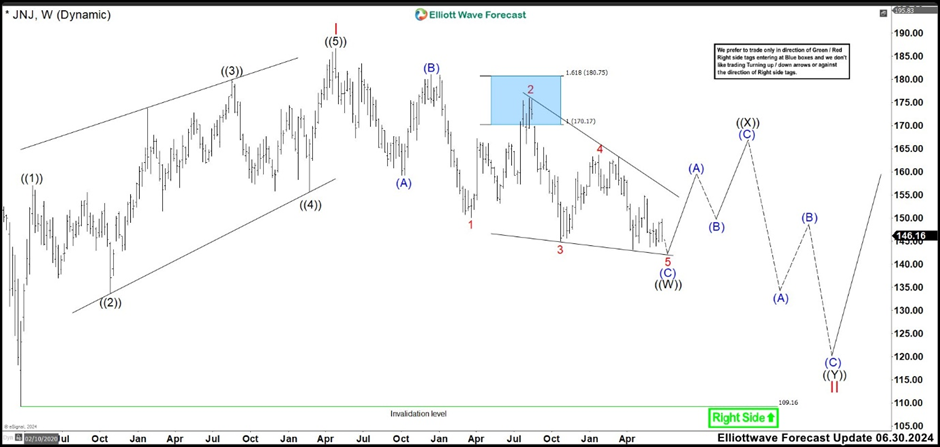
In the Weekly chart above, we have adjusted the labelling of the structure from 186.69 high. Down from the peak. We are labeling a flat correction as wave ((W)) where wave (C) is an ending diagonal. Wave (A) ended at 159.17 low in Oct 2022 and wave (B) rally finished at 181.04 high. Then, the structure looked like as a double correction because we have a lot of waves traslaped. However, the momentum lower has slowed down, suggesting that JNJ could be ready for a rally and the ending structure as wave (C) is the best option for this.
The double correction is still possible that plays out, but for that, the market needs to drop to 134.40 – 132.50 area and see a strong bounce from there. In that scenario the structure would be a double correction instead (A), (B), (C). Either way, the trade from the blue box should end soon because JNJ could rally in 3 swings at least.
JNJ daily chart June 2024
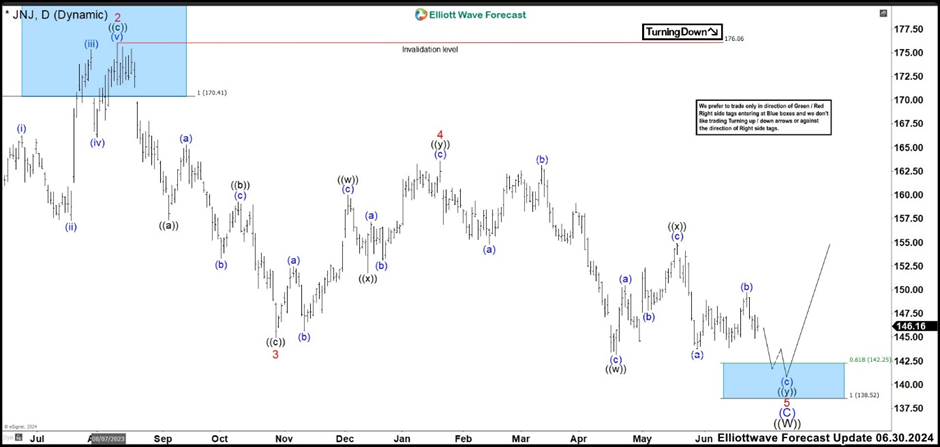
With a new Daily chart of JNJ, the market didn’t have the strengh to break the old wave A high (now wave 4) and resumed lower favoring our trade from the blue box. The price action broke below 144.95 wave 3 low, suggesting we are currently trading in wave 5 of (C). It is possible that wave 5 could be ended at 143.13 wave ((w)) low. However, the structure does not help too much and we are calling one more slighly low to end wave 5 of (C) and also wave ((W)).
If everything results as we expect, JNJ should end wave ((W)) structure in 142. 25 – 138.52 area where we have to close our trade from the blue box. Even if market could drop more as we said before to build a double correction, it is better to closed it in the area we mencioned and wait for a rally.
Check more of our analysis for currencies and cryptos in members-only area.Visit EW-Forecast for details!
FURTHER DISCLOSURES AND DISCLAIMER CONCERNING RISK, RESPONSIBILITY AND LIABILITY Trading in the Foreign Exchange market is a challenging opportunity where above average returns are available for educated and experienced investors who are willing to take above average risk. However, before deciding to participate in Foreign Exchange (FX) trading, you should carefully consider your investment objectives, level of xperience and risk appetite. Do not invest or trade capital you cannot afford to lose. EME PROCESSING AND CONSULTING, LLC, THEIR REPRESENTATIVES, AND ANYONE WORKING FOR OR WITHIN WWW.ELLIOTTWAVE- FORECAST.COM is not responsible for any loss from any form of distributed advice, signal, analysis, or content. Again, we fully DISCLOSE to the Subscriber base that the Service as a whole, the individual Parties, Representatives, or owners shall not be liable to any and all Subscribers for any losses or damages as a result of any action taken by the Subscriber from any trade idea or signal posted on the website(s) distributed through any form of social-media, email, the website, and/or any other electronic, written, verbal, or future form of communication . All analysis, trading signals, trading recommendations, all charts, communicated interpretations of the wave counts, and all content from any media form produced by www.Elliottwave-forecast.com and/or the Representatives are solely the opinions and best efforts of the respective author(s). In general Forex instruments are highly leveraged, and traders can lose some or all of their initial margin funds. All content provided by www.Elliottwave-forecast.com is expressed in good faith and is intended to help Subscribers succeed in the marketplace, but it is never guaranteed. There is no “holy grail” to trading or forecasting the market and we are wrong sometimes like everyone else. Please understand and accept the risk involved when making any trading and/or investment decision. UNDERSTAND that all the content we provide is protected through copyright of EME PROCESSING AND CONSULTING, LLC. It is illegal to disseminate in any form of communication any part or all of our proprietary information without specific authorization. UNDERSTAND that you also agree to not allow persons that are not PAID SUBSCRIBERS to view any of the content not released publicly. IF YOU ARE FOUND TO BE IN VIOLATION OF THESE RESTRICTIONS you or your firm (as the Subscriber) will be charged fully with no discount for one year subscription to our Premium Plus Plan at $1,799.88 for EACH person or firm who received any of our content illegally through the respected intermediary’s (Subscriber in violation of terms) channel(s) of communication.
Recommended content
Editors’ Picks
EUR/USD retreats from tops and retests 1.0730 on US data

EUR/USD now faces some downside pressure on the back of some recovery in the US Dollar after the JOLTs Job Openings report came in stronger than expected in May.
GBP/USD keeps the bullish bias near 1.2680

The Dollar's vacillating price action allows GBP/USD to extend its daily bounce and approach the key 1.2700 neighbourhood, as investors assess the ECB forum and US data releases.
Gold under mild selling pressure around $2,320

The precious metal now fades the initial uptick and trades with modest losses near the $2,320 zone per ounce troy in response to the data-driven bounce in the Greenback.
Crypto Today: Bitcoin gets less interest from traders, Ethereum ETF could attract $5 billion inflows

Bitcoin market sees a decline in volatility per on-chain data from Crypto Quant. Bitcoin ETFs saw a net inflow of $129 million on July 1; on-chain analysts predict a relief rally in BTC.
Eurozone inflation ticks down in June

The eurozone’s inflation rate has come down from 2.6% to 2.5%, while core inflation remained at 2.9%. Nothing in these figures would make the ECB cut again in July.