Gold stocks vs. tech stocks – The little-known link

What a perfect way to end the year! Clear breakouts, obvious breakdowns, and a major signal from tech stocks.
In my recent gold price forecast for January 2024, I wrote about the most important of the recent technical events in gold (gold’s weekly reversal), and in today’s free analysis, I’ll focus on something far less obvious.
It’s been some time since I previously covered the tech stocks – the NASDAQ Index – and it’s about time for me to catch up. After all, the technology appears to be driving the economy higher, and it’s clearly visible on the stock market. Several decades ago, “tech” stocks were a novelty, and now they are the biggest components of stock market indices. Even the most popular company in the automotive industry – Tesla – is essentially a tech company.
The initial blockchain and AI emotional upswings are over, but it doesn’t make them any less important. Remember the dot-com bubble that followed the all-things-internet bull market? It’s the same thing right now but with different tech advancements. Even though the internet was a game-changer for pretty much all aspects of the economy and everyday life, it was also true that the changes did not follow immediately and that the markets got way ahead of themselves. The same goes for blockchain and AI. There were some changes in everyday life, but not tremendous ones – at least not yet.
People’s emotionality remains unchanged despite different geopolitical and technological circumstances, and this also applies to the way in which people react to similar price moves that were triggered by analogous events. (And markets are created by people, right? Plus, algorithms, but those were essentially programmed by humans, anyway.)
Given the above, one would expect that the stock market – at least its tech indices – would behave similarly now to how it behaved around the dot-com peak.
And… That’s exactly what’s happening.
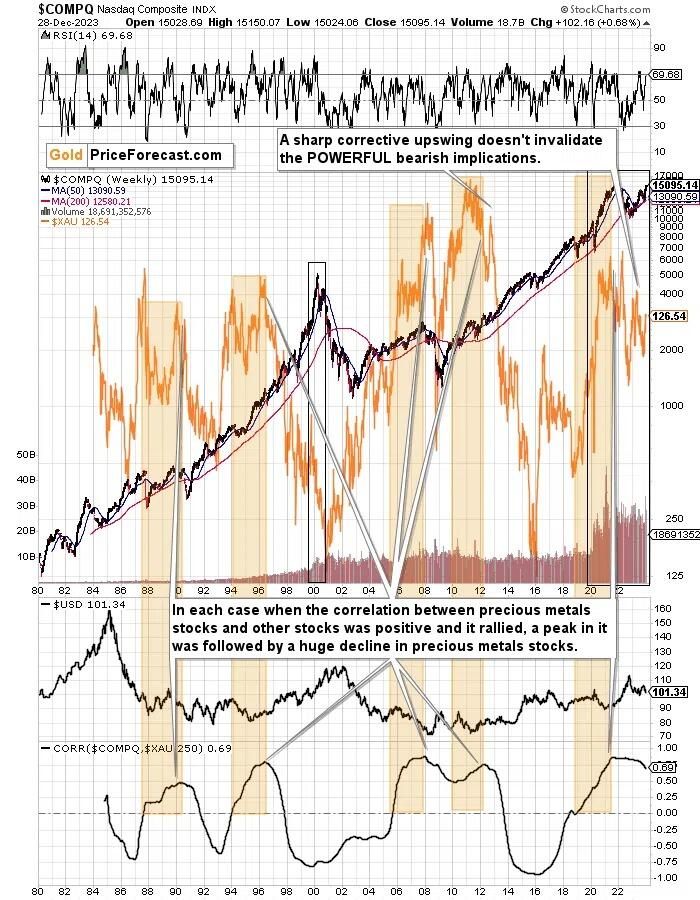
The above chart features the NASDAQ (main line) as well as gold and silver stocks (the XAU Index serves as a proxy; orange line).
There is only one period comparable to the recent over-decade-long rally, and that’s the huge rally that preceded the 2000 top. It’s not like we have to look for the analogy – clear, crystal-clear when looking at the chart for just a second.
I already described the underlying technical changes that triggered both upswings, so I want to focus on something else now. Namely, on the fact that since the long-term momentum was already broken, it’s obvious that the moment that is analogous to what we see right now is what we saw in 2000 after the top.
That was when the momentum in the previous long-term upswing was broken, and the NASDAQ moved below its 50-week moving average (marked with blue). It then moved back up again, but that was not the continuation of the uptrend, even though it looked like it. In reality, it was the first correction after the start of a massive decline.
This is most likely where we see tech stocks right now, as well. We saw the distinct slide below the 50-week moving average, and now we experienced a short-term rally. Some will say that this is just the continuation of the previous long-term uptrend, but the historical analogy suggests otherwise. It seems much more like the first correction after the start of a massive decline.
Now, if tech stocks are about to turn south and then decline in a really substantial manner, what does it imply for the precious metals market?
There are times when tech stocks and precious metals stocks move in the same direction, and there are times when they move in the opposite directions. For example, they plunged together in 2008 and in 2020. This is one of those times, and you can see details in the bottom part of the above chart.
The correlation coefficient that’s visible there takes values from -1 to 1, and the closer it is to -1, the more markets tend to move in the opposite directions, closer to 1 it is, the more markets move in the same direction, and the closer to 0 it is, the more markets move regardless of each other.
At 0.69, the coefficient indicates a situation in which both markets move in the same direction.
This means that a big move lower in the NASDAQ is likely to translate into a big move lower in other stocks and also in mining stocks, quite likely also in copper.
And by bigger, I don’t mean “just big”. Based on the past patterns in the tech stocks, it seems that a 2008-style decline – or worse – is to be expected. This means a huge decline in mining stocks is likely around the corner.
Truth be told, such a bearish storm for mining stocks has been brewing for some time. It’s clear once you look at the correlation coefficient itself and focus on the times when it’s been rising for a long time, and then it started to decline.
I marked the rallies (usually from the 0 level) in the correlation with orange rectangles. In each of the previous cases, when the correlation peaked, it meant that the XAU Index was about to move significantly lower. As you can see on the above chart, the correlation peaked in 2021 and while the XAU has declined since that time, the size of the decline is not yet comparable to what used to happen after similar signals.
This means that gold and silver mining stocks have likely not declined enough just yet. Therefore, they are likely to slide much more in the following months. This move lower started in 2022, and given the recent short-term events, it seems that it’s about to continue. There will be short-term trading opportunities in both directions, but the underlying big trend in the mining stocks is currently down. And if that’s not clear, please consider the fact that while gold is well above its 2008 highs, gold and silver stocks are well below that high. In fact, they are even below their 2006 high.
On a short-term basis, we see that the GDXJ declined on Friday, which means that overall, junior miners declined last week. This means that the situation developed in tune with my previous expectations and, in consequence, my previous comments on its chart, remain up-to-date:
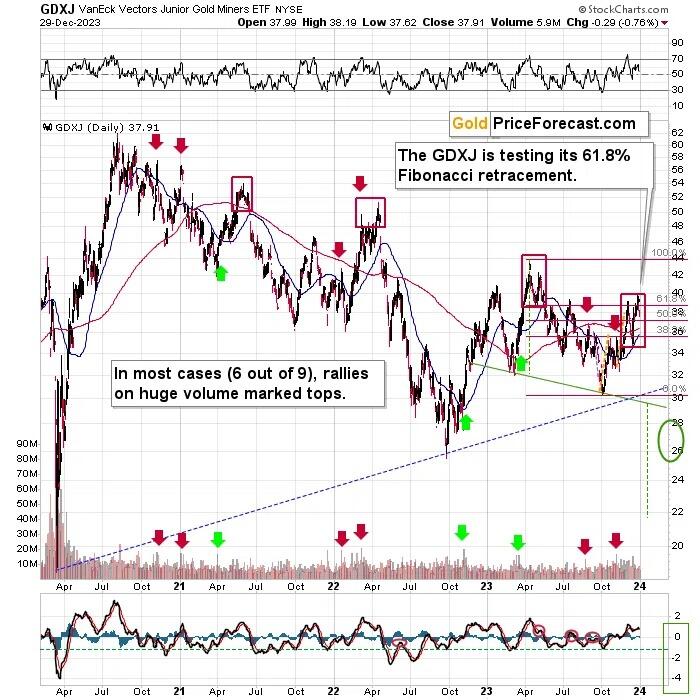
In case of this ETF, the link between big-volume rallies and local tops is not as clear as it is in case of silver, but it’s still present. I marked the similar cases with arrows and in 6 out of 9 such cases, big-volume rallies marked local tops, or those tops followed very soon. Only in 3 out of 9 cases, big rallies followed.
Interestingly, all those three bullish cases were preceded by declines that were much bigger than what we saw recently. This suggests that the bullish analogies are not the correct ones. The bearish ones are.
Moreover, please take a look at the areas that I marked with red rectangles. They mark important tops in the GDXJ ETF. In call those cases, junior miners topped by first declining somewhat, then correcting, and then sliding without looking back. In two out of three cases the second (final) top was below the initial one, and in the remaining case (in early 2022), the second (final) top, was slightly higher than the initial one.
So, is seeing the GDXJ close to the previous top (but still below it) a bullish game-changer? Absolutely not.
In other words, the NASDAQ-based analogy might re-start and the powerful downswing might continue from the current price levels.
All in all, the outlook for the precious metals market remains strongly bearish and the potential for our current trading positions in junior mining stocks remains enormous.
Want free follow-ups to the above article and details not available to 99%+ investors? Sign up to our free newsletter today!
Author

Przemyslaw Radomski, CFA
Sunshine Profits
Przemyslaw Radomski, CFA (PR) is a precious metals investor and analyst who takes advantage of the emotionality on the markets, and invites you to do the same. His company, Sunshine Profits, publishes analytical software that any


