GBP/JPY Price Forecast: Intervention shock exposes 210.00
- GBP/JPY plunges below 200-day SMA after intervention speculation.
- Oversold RSI warns sellers may face mean-reversion rebound.
- Break below 210.00 exposes 209.64 and 209.00 support.

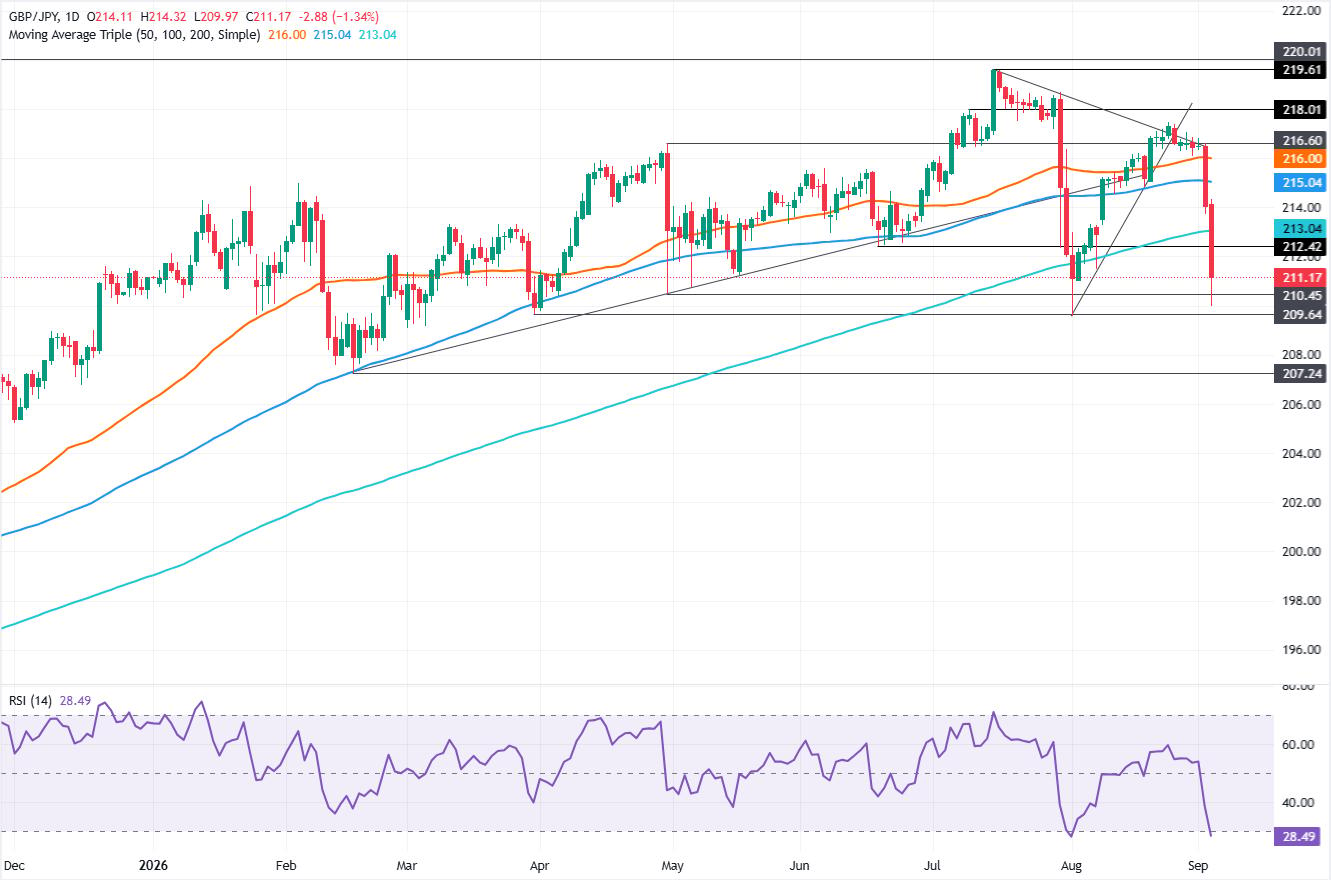
The GBP/JPY tanks amid speculation of intervention by Japanese authorities in the FX markets, driven by a rate check by Tokyo. The cross-pair drops more than 300 pips, trades at 210.92, down by more than 1.40%.
GBP/JPY Price Forecast: Technical Outlook
On Thursday, GBP/JPY extended its losses, clearing the 200-day Simple Moving Average (SMA) at 213.04 on its way towards the 210.00 area, leaving behind the 212.00 and 211.00 psychological levels.
Momentum shifted bearishly, as seen in the Relative Strength Index (RSI), which turned oversold, indicating that the pair may be susceptible to a mean-reversion move. This is possible if the RSI gets above the 30 level.
For a bullish recovery, the GBP/JPY must clear the 212.00 area ahead of challenging the 200-day SMA at 213.06. If cleared, the next area of interest in play will be the 100-day SMA at 215.04.
Conversely, the path of least resistance is for GBP/JPY to dive below 210.00, with a move to the March 31 swing low of 209.64 on the cards. On further weakness, the next area of support would be the 209.00 milestone.
GBP/JPY Price Chart – Daily
Japanese Yen Price This week
The table below shows the percentage change of Japanese Yen (JPY) against listed major currencies this week. Japanese Yen was the strongest against the New Zealand Dollar.
| USD | EUR | GBP | JPY | CAD | AUD | NZD | CHF | |
|---|---|---|---|---|---|---|---|---|
| USD | -0.36% | 0.07% | -2.45% | -0.85% | -0.58% | 0.70% | -0.05% | |
| EUR | 0.36% | 0.44% | -2.09% | -0.49% | -0.22% | 1.02% | 0.33% | |
| GBP | -0.07% | -0.44% | -2.62% | -0.93% | -0.67% | 0.57% | -0.20% | |
| JPY | 2.45% | 2.09% | 2.62% | 1.56% | 1.90% | 3.10% | 2.34% | |
| CAD | 0.85% | 0.49% | 0.93% | -1.56% | 0.26% | 1.53% | 0.73% | |
| AUD | 0.58% | 0.22% | 0.67% | -1.90% | -0.26% | 1.25% | 0.47% | |
| NZD | -0.70% | -1.02% | -0.57% | -3.10% | -1.53% | -1.25% | -0.77% | |
| CHF | 0.05% | -0.33% | 0.20% | -2.34% | -0.73% | -0.47% | 0.77% |
The heat map shows percentage changes of major currencies against each other. The base currency is picked from the left column, while the quote currency is picked from the top row. For example, if you pick the Japanese Yen from the left column and move along the horizontal line to the US Dollar, the percentage change displayed in the box will represent JPY (base)/USD (quote).
Author

Christian Borjon Valencia
FXStreet
Markets analyst, news editor, and trading instructor with over 14 years of experience across FX, commodities, US equity indices, and global macro markets.