- GBP/JPY pinned to 200.00 handle in rough price action.
- Japan GDP disappointment gives way to BOJ rate call on Friday.
- UK labor figures due Wednesday, unemployment claims expected to rise.
GBP/JPY continues to churn around 200.00 in choppy intraday action on Monday, extending a near-term consolidation phase as both currencies grapple with disappointment in economic data.
Japanese Gross Domestic Product (GDP) growth declined in Q1, contracting -0.5% QoQ. Easing economic figures will make it even more difficult for the Bank of Japan (BoJ) to unglue itself from a hyper-easy monetary policy stance, and investors will be focusing down the BoJ’s rate call and policy statement due early Friday.
UK labor data is due in the Tuesday market session, and markets are expecting an uptick in monthly Claimant Count Change figures in May. Median market forecasts expect a rise to 10.2K from the previous 8.9K. The ILO Unemployment Rate is expected to hold steady at 4.3% for the three-month period through April, while investors will be keeping a close eye on the 3-month Employment Change through April which last showed a -177K contraction in UK employed positions.
GBP/JPY technical outlook
Hourly candles have turned into a sideways affair, driving into a rough consolidation pattern around the 200-hour Exponential Moving Average (EMA) at 199.38. The pair recovered from a recent dip to June’s lows near 197.50, but the Guppy still remains down from multi-decade highs above 200.60.
GBP/JPY hourly chart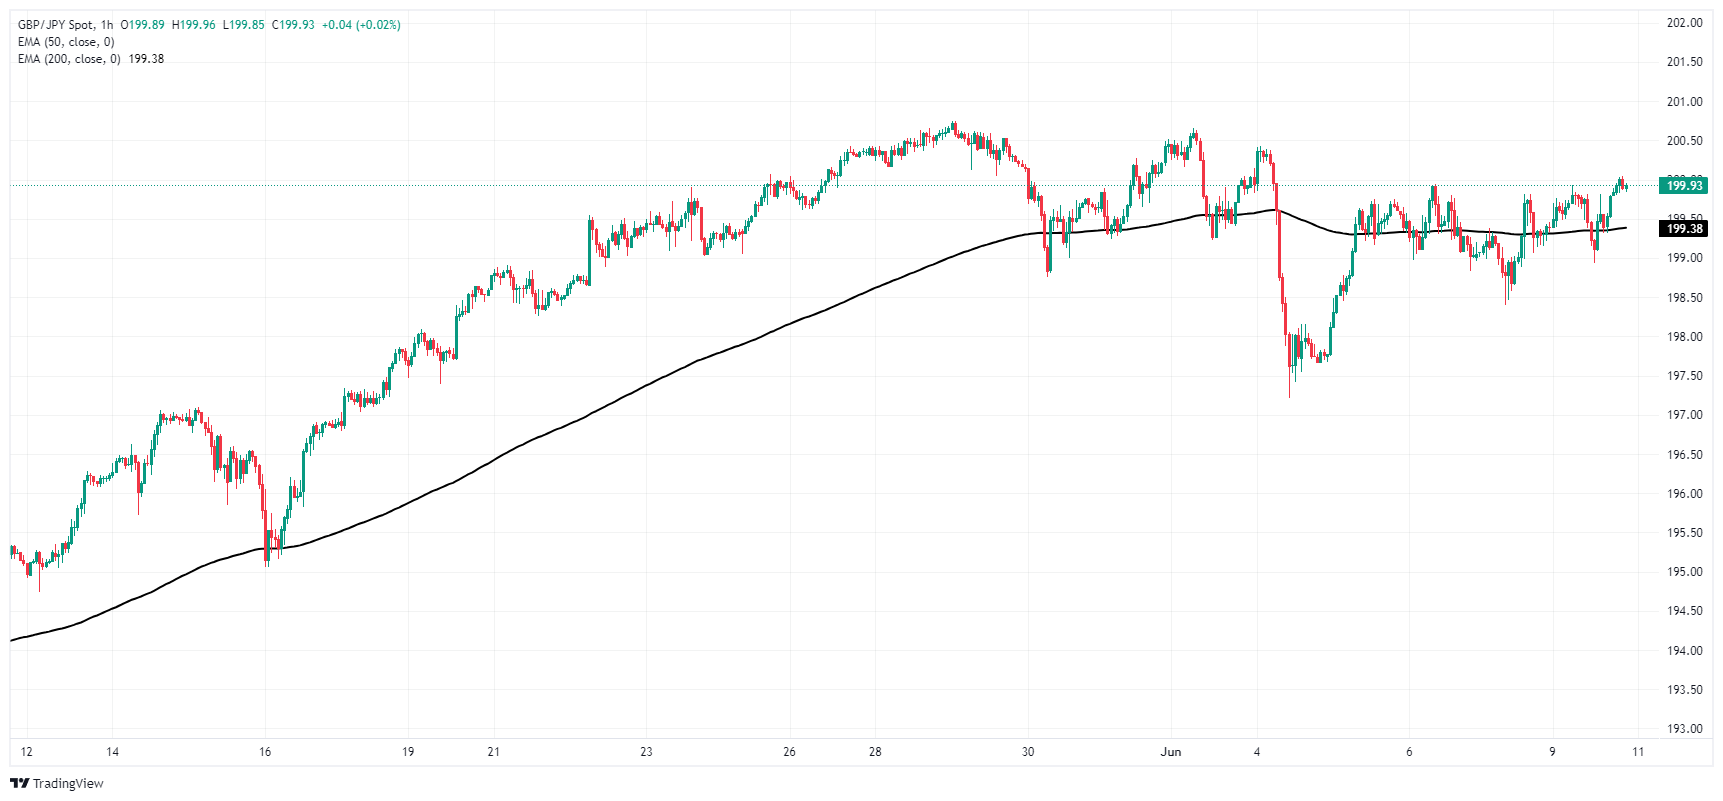
GBP/JPY daily chart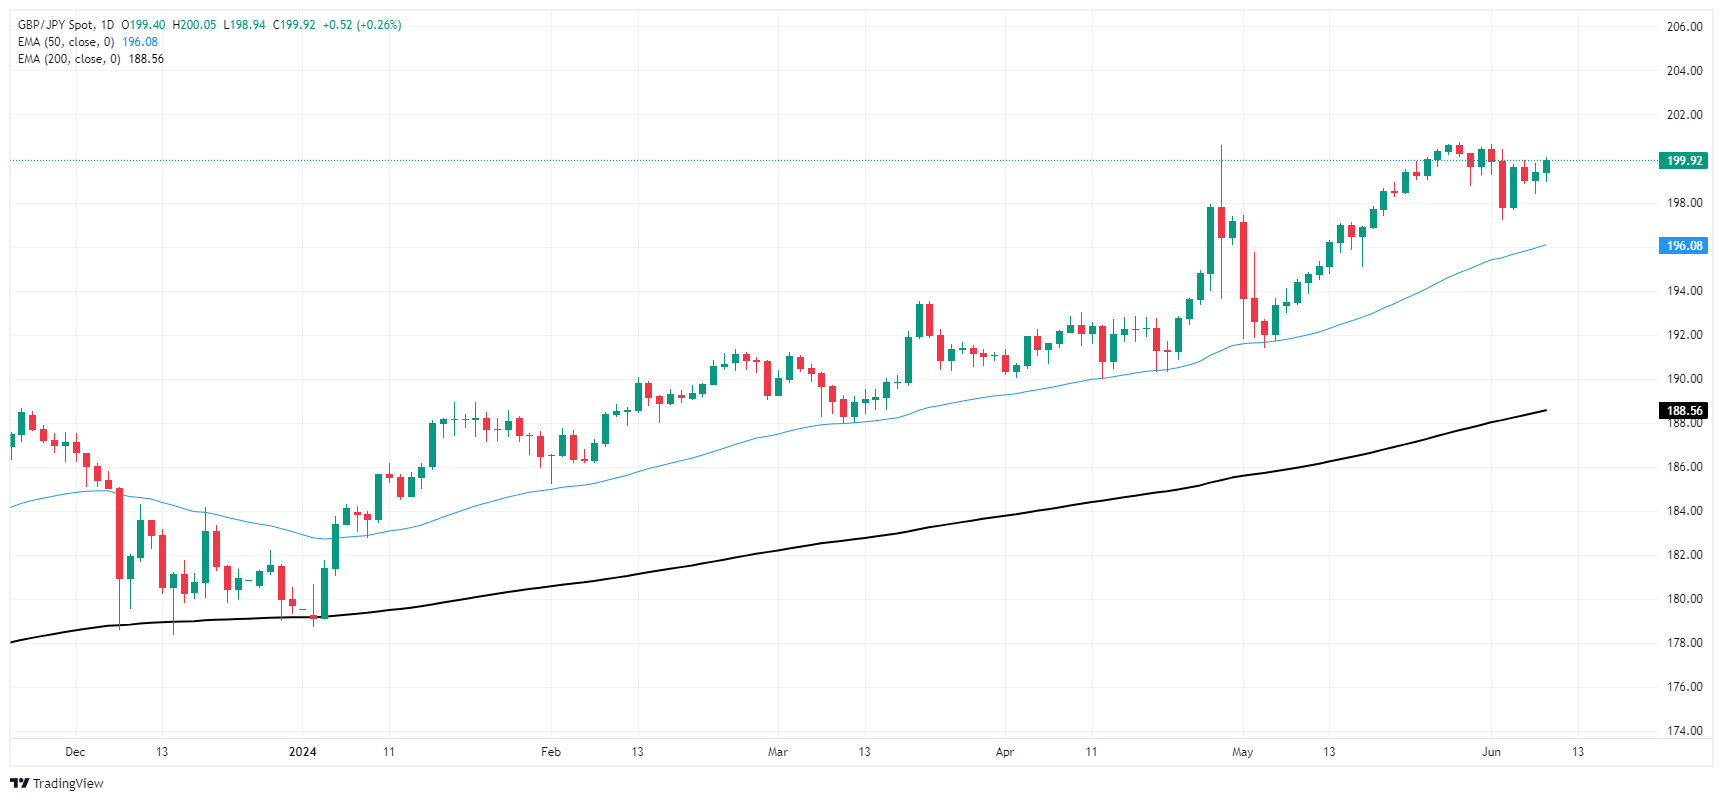
Information on these pages contains forward-looking statements that involve risks and uncertainties. Markets and instruments profiled on this page are for informational purposes only and should not in any way come across as a recommendation to buy or sell in these assets. You should do your own thorough research before making any investment decisions. FXStreet does not in any way guarantee that this information is free from mistakes, errors, or material misstatements. It also does not guarantee that this information is of a timely nature. Investing in Open Markets involves a great deal of risk, including the loss of all or a portion of your investment, as well as emotional distress. All risks, losses and costs associated with investing, including total loss of principal, are your responsibility. The views and opinions expressed in this article are those of the authors and do not necessarily reflect the official policy or position of FXStreet nor its advertisers. The author will not be held responsible for information that is found at the end of links posted on this page.
If not otherwise explicitly mentioned in the body of the article, at the time of writing, the author has no position in any stock mentioned in this article and no business relationship with any company mentioned. The author has not received compensation for writing this article, other than from FXStreet.
FXStreet and the author do not provide personalized recommendations. The author makes no representations as to the accuracy, completeness, or suitability of this information. FXStreet and the author will not be liable for any errors, omissions or any losses, injuries or damages arising from this information and its display or use. Errors and omissions excepted.
The author and FXStreet are not registered investment advisors and nothing in this article is intended to be investment advice.
Recommended content
Editors’ Picks
EUR/USD retreats to 1.0700 area following post-PCE jump

After spiking to a daily high of 1.0720 with the immediate reaction to US PCE inflation data, EUR/USD lost its traction and declined to the 1.0700 area. Investors remain cautious ahead of this weekend's French election and make it difficult for the Euro to gather strength.
GBP/USD stays below 1.2650 after US inflation data

GBP/USD struggles to preserve its bullish momentum and trades below 1.2650 in the American session on Friday. Earlier in the day, the data from the US showed that the annual core PCE inflation declined to 2.6% in May, limiting the USD's upside and helping the pair hold its ground.
Gold keeps its daily gains near $2,330 following US PCE data

Gold prices maintain their constructive bias around $2,330 after US inflation readings gauged by the PCE matched consensus in May and US yields advance slightly across the curve.
BTC struggles around the $62,000 level

Bitcoin price faces pullback resistance at the lower band of the descending wedge around $62,000. Ethereum price finds support at $3,288, the 61.8% Fibonacci retracement level. Ripple price faces resistance at $0.500, its daily resistance level.
French Elections Preview: Euro to suffer after the calm, as specter of extremists, uncertainty rise Premium

The first round of French parliamentary elections is set to trigger high uncertainty. Soothing messages from the far right and far left leave the Euro vulnerable to falls. Calm may return only after the second round of voting on July 7.