Dow Jones Industrial Average prints a record the Nasdaq paid for
- The Dow Jones Industrial Average notched a fresh intraday record, lifted by healthcare, financials and industrials as money rotated out of technology.
- Surging memory chip prices split the market, rewarding chipmakers while squeezing Big Tech buyers like Apple.
- In-line core PCE and a hot first-quarter GDP print keep the Fed's restrictive hold firmly in place.

The Dow Jones Industrial Average (DJIA) printed a fresh intraday record near 52,650 on Thursday before easing back toward 52,200, and the temptation is to read that high as a broad vote of confidence. It was nothing of the sort. The blue-chip index was up about 0.7% on the session while the Nasdaq Composite slipped around 0.3%, a split that says money was not flooding in so much as shuffling between names. The record was built on the corners of the market that have spent the year out of fashion: healthcare, financials and industrials. Johnson & Johnson and JPMorgan Chase each added more than 2%, and Caterpillar jumped close to 5%.
The unfashionable do the lifting
What usually leaves the Dow lagging during an artificial intelligence (AI) melt-up worked in its favour here. Its price-weighted, industrial-heavy construction means it carries less of the megacap technology that drives the broad indices, so it barely noticed those names rolling over. With cyclical and value stocks doing the heavy lifting, the rotation that hammered momentum read as a tailwind rather than a drag.
The chip boom cuts both ways
The engine here is the memory market, and it is running hot. Demand for the high-bandwidth memory (HBM) that feeds AI data centres has pulled manufacturing capacity away from conventional chips, and prices for everyday memory have climbed sharply through the year. For the companies that make the stuff, that is a windfall. Micron surged around 14% after a blowout quarter, posting record revenue, margins north of 80% and its premium memory sold out into next year. Qualcomm added roughly 6% on firmer guidance, and sympathy bids lifted other chip names including Western Digital and Applied Materials.
The other side of that same trade is far less cheerful, because every company that buys chips rather than sells them now faces a rising input bill. Apple dropped close to 5% after lifting MacBook and iPad prices and blaming component costs. Alphabet and Meta each shed about 1% on the worry that fatter memory bills will crimp margins. The AI boom has stopped being a tide that lifts all of technology; it is now a transfer of value from the firms that consume silicon to the few that produce it.
Sticky inflation, resilient growth
The Personal Consumption Expenditures Price Index (PCE), the inflation gauge the Federal Reserve (Fed) watches most closely, rose 0.3% MoM and 3.4% YoY at the core level, both in line with expectations. That annual core reading was the firmest since October 2023, so inflation is not rolling over; landing in line simply spared the market a hawkish surprise. Headline PCE rose 0.4% MoM, a shade under the 0.5% the consensus had feared.
The growth side of the ledger ran hotter, and that mattered more for the rotation than the inflation print did. First-quarter Gross Domestic Product (GDP) was revised up to 2.1% annualized against a 1.6% estimate. Jobless claims fell to 215K, and personal income and spending each climbed 0.7%. For the Fed, which held at 3.75% last week with projections pointing to little relief this year, the mix changes nothing: growth is holding and inflation is sticky, exactly the backdrop a central bank leans on to justify sitting still. The 10-year Treasury yield eased a couple of basis points toward 4.37%, a quiet sign nobody saw reason to panic.
Where it trades from here
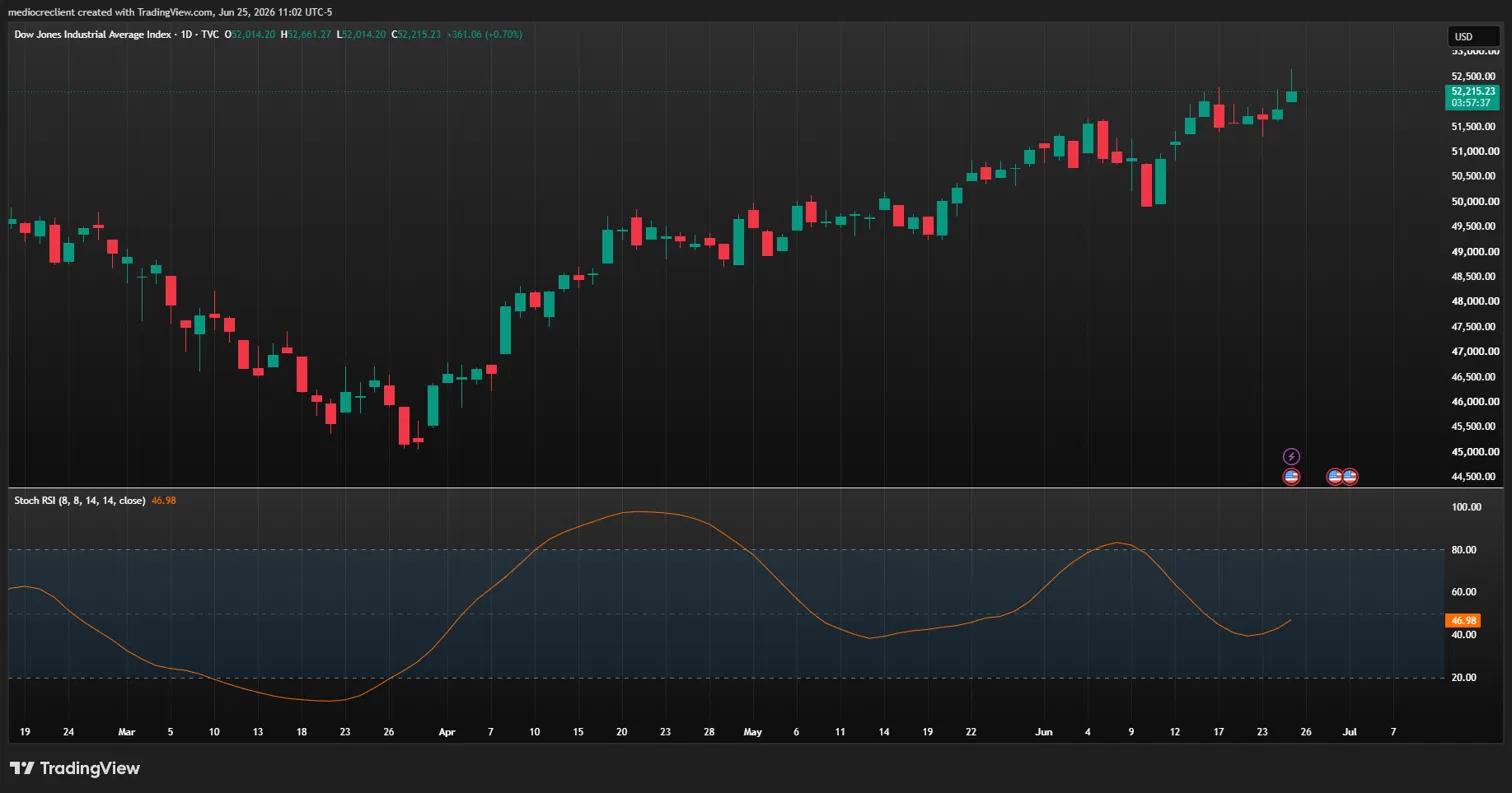
Resistance sits at the record zone near 52,650, and a clean break opens the 52,700 level before the 53,000 round number comes into view. With the daily Stochastic Relative Strength Index (Stoch RSI) sitting mid-range near 47, the trend reads as having room to extend rather than being exhausted.
Support runs first at the 52,200 area where the index steadied after fading from its high, then the 52,000 handle that floored Thursday's pullback. Below that, the prior June base around 51,800 is the line that would signal the rotation has curdled into something broader and uglier.
Bias stays higher while price holds above 52,000, but with a caveat that should not be ignored: this is a record carried by a narrow band of cyclicals, not the whole tape. A short-term Stoch RSI buried near 7 says the pullback is stretched, so a bounce is the higher-odds near-term path; the durability of any new high hangs on whether participation broadens or technology keeps bleeding. Records built on rotation hold up right until the rotation runs out of names to rotate into.
Dow Jones daily chart
Dow Jones FAQs
The Dow Jones Industrial Average, one of the oldest stock market indices in the world, is compiled of the 30 most traded stocks in the US. The index is price-weighted rather than weighted by capitalization. It is calculated by summing the prices of the constituent stocks and dividing them by a factor, currently 0.152. The index was founded by Charles Dow, who also founded the Wall Street Journal. In later years it has been criticized for not being broadly representative enough because it only tracks 30 conglomerates, unlike broader indices such as the S&P 500.
Many different factors drive the Dow Jones Industrial Average (DJIA). The aggregate performance of the component companies revealed in quarterly company earnings reports is the main one. US and global macroeconomic data also contributes as it impacts on investor sentiment. The level of interest rates, set by the Federal Reserve (Fed), also influences the DJIA as it affects the cost of credit, on which many corporations are heavily reliant. Therefore, inflation can be a major driver as well as other metrics which impact the Fed decisions.
Dow Theory is a method for identifying the primary trend of the stock market developed by Charles Dow. A key step is to compare the direction of the Dow Jones Industrial Average (DJIA) and the Dow Jones Transportation Average (DJTA) and only follow trends where both are moving in the same direction. Volume is a confirmatory criteria. The theory uses elements of peak and trough analysis. Dow’s theory posits three trend phases: accumulation, when smart money starts buying or selling; public participation, when the wider public joins in; and distribution, when the smart money exits.
There are a number of ways to trade the DJIA. One is to use ETFs which allow investors to trade the DJIA as a single security, rather than having to buy shares in all 30 constituent companies. A leading example is the SPDR Dow Jones Industrial Average ETF (DIA). DJIA futures contracts enable traders to speculate on the future value of the index and Options provide the right, but not the obligation, to buy or sell the index at a predetermined price in the future. Mutual funds enable investors to buy a share of a diversified portfolio of DJIA stocks thus providing exposure to the overall index.
Author

Joshua Gibson
FXStreet
Joshua joins the FXStreet team as an Economics and Finance double major from Vancouver Island University with twelve years' experience as an independent trader focusing on technical analysis.