- Dow Jones backslides as other indexes gain ground.
- DJIA gets dragged down by steep declines in large caps.
- US data softened slightly on Tuesday, but not enough to appease rate cut hopes.
The Dow Jones Industrial Average (DJIA) shed weight on Tuesday, declining around 300 points as heavy-hitters like Home Depot Inc. (HD) and Walmart Inc. (WMT) dragged the large-industry index into the red. US equities are gaining ground in a lop-sided index performance, with losses concentrated in key securities on the Dow Jones.
The CB Consumer Confidence survey index declined to 100.4 in June, down from the previous print of 102.0 but falling just short of the expected decline to 100.0. The Richmond Fed’s Manufacturing Index dropped sharply to -10.0 in June, far below the forecast increase to 2.0 from the previous 0.0.
Financial markets broadly hopeful for softly-weakening economic figures from the US will be pivoting to watch for US Durable Goods, Gross Domestic Product (GDP), and Personal Consumption Expenditure Price Index (PCE) inflation figures all slated for release in the back half of the trading week beginning on Thursday. Tuesday’s mid-tier releases weren’t enough to spark firm market flows in either direction.
According to the CME’s FedWatch Tool, rate markets continue to price in around 66% odds of at least a quarter-point rate cut from the Federal Reserve (Fed) in September. Rate-cut-hungry investors are running out of room to hope that a downturn in US economic figures will spark an early rate cut from the Federal Open Market Committee (FOMC), while a too-sharp drop in US economic activity could spark a broad risk-off flight into safe havens like the US Dollar. On the other hand, a resurgence in US economic activity would likewise spoil investor sentiment, as rate cut hopes hinge on a slow trudge into a soft-landing recession within the US’ domestic economy.
Dow Jones news
The Dow Jones is getting dragged lower by downside in key securities on Tuesday. The DJIA is broadly in the red for the day, with only a third of the index’s securities in the green, but steep losses are concentrated in key stocks. Home Depot Inc. (HD) tumbled around 4% to $337.70 per share, followed by Walmart Inc. (WMT) which shed 2.78% and fell below $67.00 per share. Boeing Co. (BA) and Nike Inc. (NKE) were close behind, backsliding around 2.33% apiece to $53.35 and $95.11 per share, respectively.
Tuesday gainers remain notably thin, with Amazon.com Inc. (AMZN) and Apple Inc. (AAPL) climbing a little over 1% each. Amazon gained ground to $187.64 per share while Apple crossed above $210.00 per share after Monday’s decline below $208.00.
Dow Jones technical outlook
The Dow Jones is on pace to close firmly lower on Tuesday in the index’s worst single-day performance since late May as the index slumps three-quarters of one percent on the day. An intraday recovery is seeing limited effect, but is dragging Tuesday’s bids back up from the day’s bottom at 38,982.37.
Daily candlesticks continue to grind out chart paper just north of the 50-day Exponential Moving Average (EMA) at 38,864.49, with long-term technical support from the 200-day EMA at 37,455.71. Despite holding in bull country, the Dow Jones has struggled to make firm gains after a -5.15% backslide from all-time highs above 40,000.00 reached in mid-May.
Dow Jones five-minute chart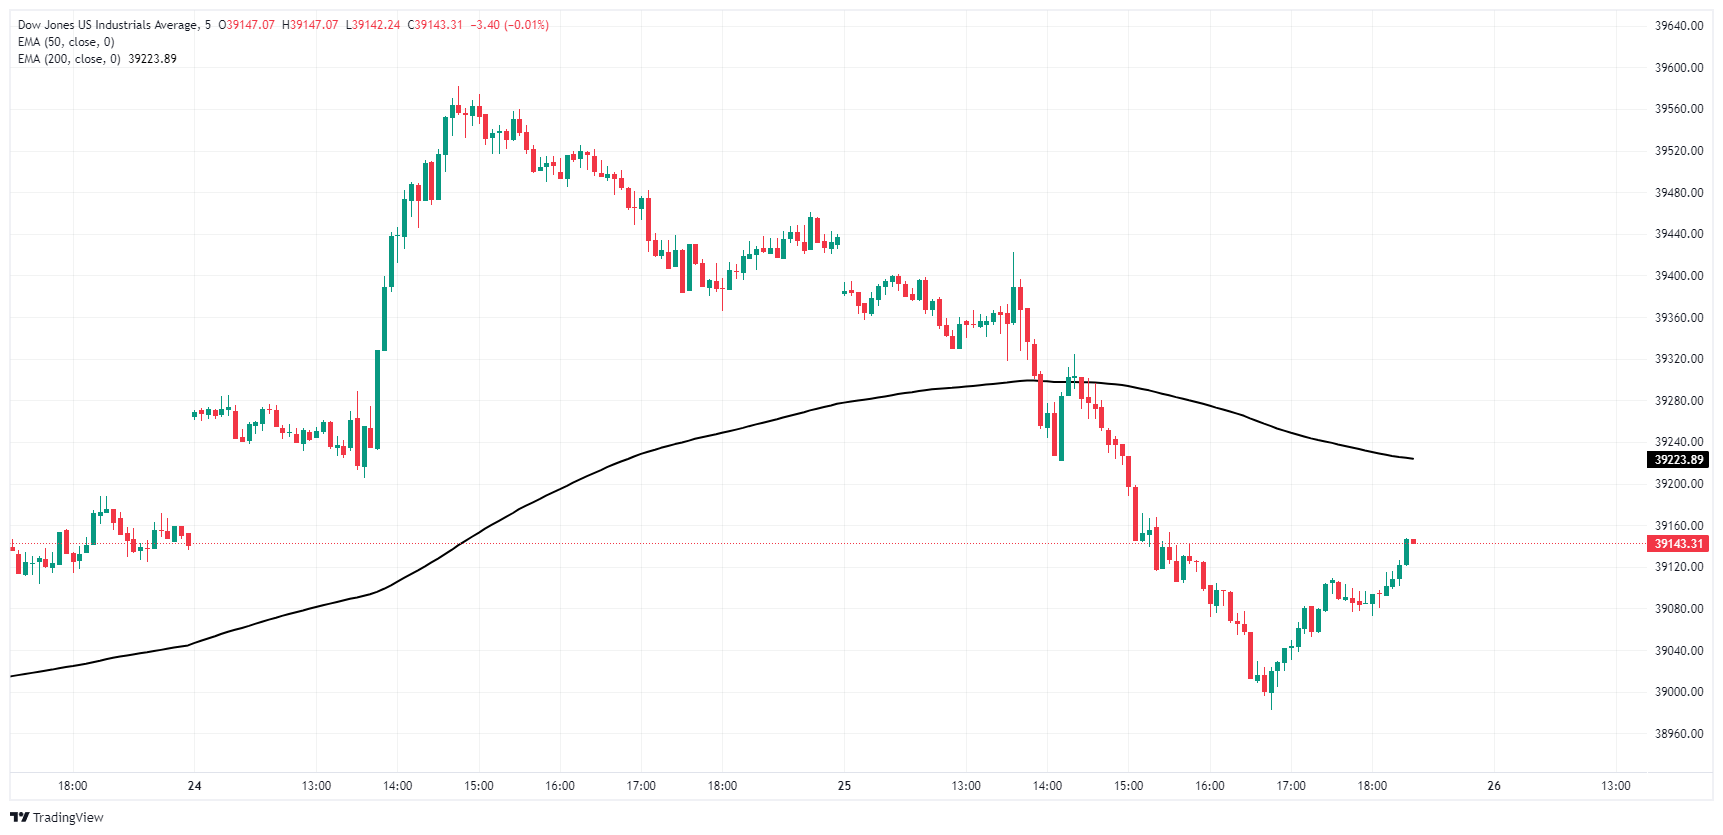
Dow Jones daily chart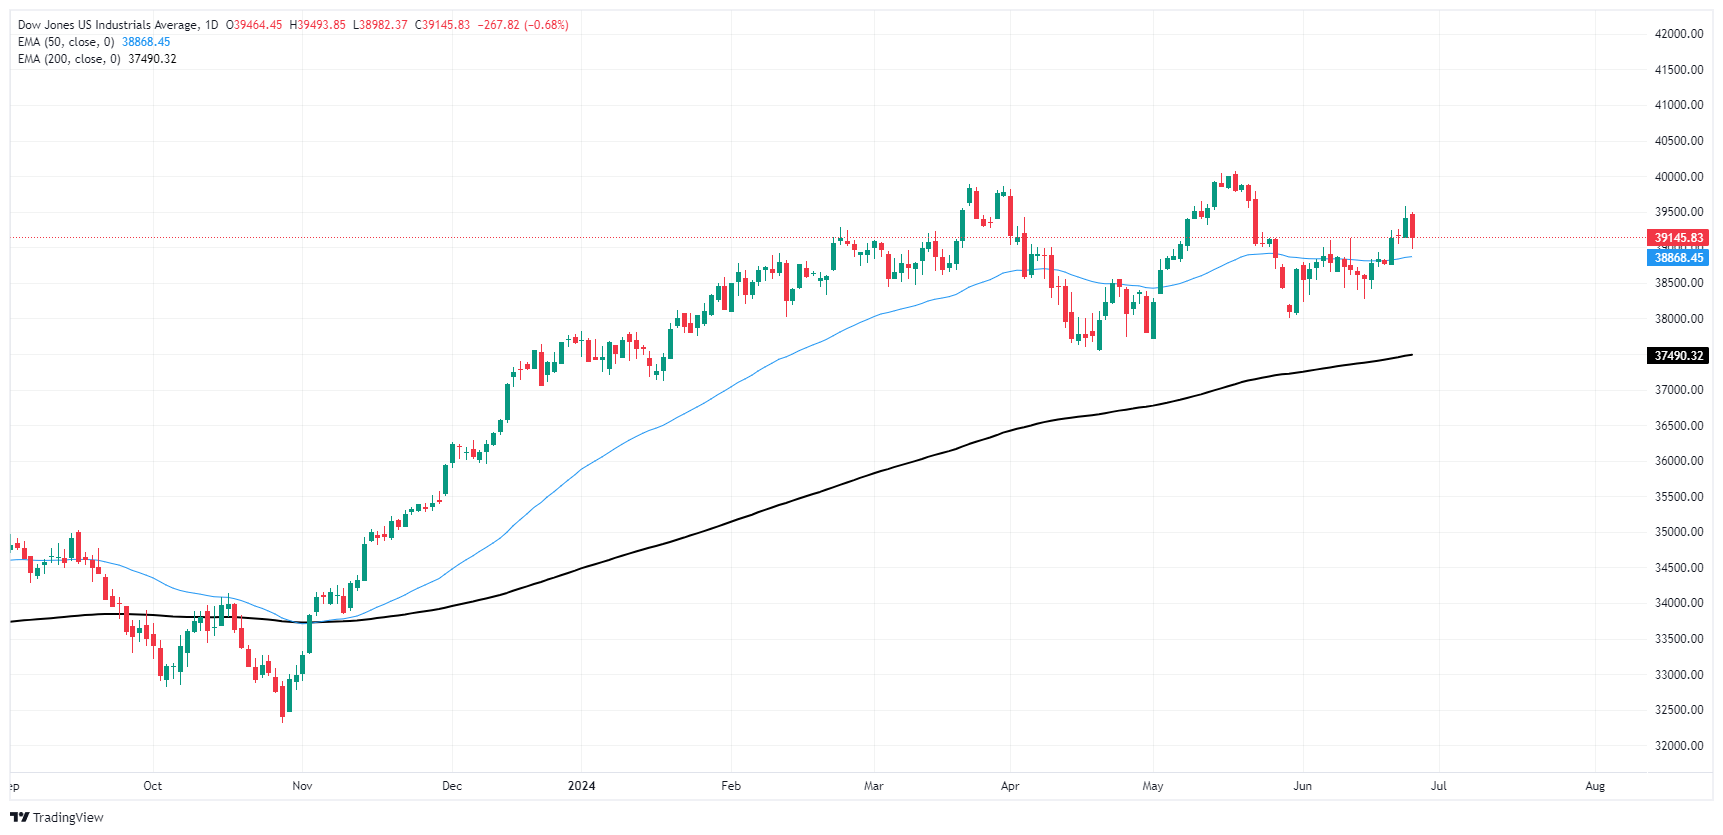
Dow Jones FAQs
The Dow Jones Industrial Average, one of the oldest stock market indices in the world, is compiled of the 30 most traded stocks in the US. The index is price-weighted rather than weighted by capitalization. It is calculated by summing the prices of the constituent stocks and dividing them by a factor, currently 0.152. The index was founded by Charles Dow, who also founded the Wall Street Journal. In later years it has been criticized for not being broadly representative enough because it only tracks 30 conglomerates, unlike broader indices such as the S&P 500.
Many different factors drive the Dow Jones Industrial Average (DJIA). The aggregate performance of the component companies revealed in quarterly company earnings reports is the main one. US and global macroeconomic data also contributes as it impacts on investor sentiment. The level of interest rates, set by the Federal Reserve (Fed), also influences the DJIA as it affects the cost of credit, on which many corporations are heavily reliant. Therefore, inflation can be a major driver as well as other metrics which impact the Fed decisions.
Dow Theory is a method for identifying the primary trend of the stock market developed by Charles Dow. A key step is to compare the direction of the Dow Jones Industrial Average (DJIA) and the Dow Jones Transportation Average (DJTA) and only follow trends where both are moving in the same direction. Volume is a confirmatory criteria. The theory uses elements of peak and trough analysis. Dow’s theory posits three trend phases: accumulation, when smart money starts buying or selling; public participation, when the wider public joins in; and distribution, when the smart money exits.
There are a number of ways to trade the DJIA. One is to use ETFs which allow investors to trade the DJIA as a single security, rather than having to buy shares in all 30 constituent companies. A leading example is the SPDR Dow Jones Industrial Average ETF (DIA). DJIA futures contracts enable traders to speculate on the future value of the index and Options provide the right, but not the obligation, to buy or sell the index at a predetermined price in the future. Mutual funds enable investors to buy a share of a diversified portfolio of DJIA stocks thus providing exposure to the overall index.
Information on these pages contains forward-looking statements that involve risks and uncertainties. Markets and instruments profiled on this page are for informational purposes only and should not in any way come across as a recommendation to buy or sell in these assets. You should do your own thorough research before making any investment decisions. FXStreet does not in any way guarantee that this information is free from mistakes, errors, or material misstatements. It also does not guarantee that this information is of a timely nature. Investing in Open Markets involves a great deal of risk, including the loss of all or a portion of your investment, as well as emotional distress. All risks, losses and costs associated with investing, including total loss of principal, are your responsibility. The views and opinions expressed in this article are those of the authors and do not necessarily reflect the official policy or position of FXStreet nor its advertisers. The author will not be held responsible for information that is found at the end of links posted on this page.
If not otherwise explicitly mentioned in the body of the article, at the time of writing, the author has no position in any stock mentioned in this article and no business relationship with any company mentioned. The author has not received compensation for writing this article, other than from FXStreet.
FXStreet and the author do not provide personalized recommendations. The author makes no representations as to the accuracy, completeness, or suitability of this information. FXStreet and the author will not be liable for any errors, omissions or any losses, injuries or damages arising from this information and its display or use. Errors and omissions excepted.
The author and FXStreet are not registered investment advisors and nothing in this article is intended to be investment advice.
Recommended content
Editors’ Picks
EUR/USD retreats to 1.0700 area following post-PCE jump

After spiking to a daily high of 1.0720 with the immediate reaction to US PCE inflation data, EUR/USD lost its traction and declined to the 1.0700 area. Investors remain cautious ahead of this weekend's French election and make it difficult for the Euro to gather strength.
GBP/USD stays below 1.2650 after US inflation data

GBP/USD struggles to preserve its bullish momentum and trades below 1.2650 in the American session on Friday. Earlier in the day, the data from the US showed that the annual core PCE inflation declined to 2.6% in May, limiting the USD's upside and helping the pair hold its ground.
Gold keeps its daily gains near $2,330 following US PCE data

Gold prices maintain their constructive bias around $2,330 after US inflation readings gauged by the PCE matched consensus in May and US yields advance slightly across the curve.
BTC struggles around the $62,000 level

Bitcoin price faces pullback resistance at the lower band of the descending wedge around $62,000. Ethereum price finds support at $3,288, the 61.8% Fibonacci retracement level. Ripple price faces resistance at $0.500, its daily resistance level.
French Elections Preview: Euro to suffer after the calm, as specter of extremists, uncertainty rise Premium

The first round of French parliamentary elections is set to trigger high uncertainty. Soothing messages from the far right and far left leave the Euro vulnerable to falls. Calm may return only after the second round of voting on July 7.