Dow Jones Industrial Average Forecast: DJIA cycles lower, Thursday’s Initial Jobless Claims await
- US Treasury yields rise again as rate-cutting bets reduce.
- US Retail Sales data for December came in hot.
- Dow Jones Industrial Average closed on Tuesday below 21-day Simple Moving Average for first time since November 1.
- JPMorgan, UnitedHealth and Goldman Sachs report earnings beats, Travelers reports on Friday.

The Dow Jones Industrial Average (DJIA) lost value for its third consecutive session on Wednesday. The DJIA pulled back 0.25% on Wednesday, which turned out to be better than the S&P 500 and NASDAQ Composite’s 0.56% and 0.59%, respectively. The sell-off had been much worse earlier in the session.
US Retail Sales for December overpowered the consensus early Wednesday, which provided more negativity in conjunction with recent hawkish Fed governor statements to imply that Federal Reserve (Fed) rate cutting might take longer than expected.
After the close, Alcoa (AA) reported a $150 million loss for the fourth quarter on revenues that shrank 2.5% YoY. Dow Jones futures were also lower as the calendar turns to Thursday. Now equity investors will wait for the Initial Jobless Claims that arrive one hour before the open.
Dow investors have already digested three fourth-quarter earnings results from its components and look forward to Friday’s earnings call from Travelers (TRV).
Dow Jones News: Markets lower bets on March, May rate cuts
The US Census Bureau reported that US Retail Sales for December gained 0.6% on a monthly basis. The consensus had called for 0.4% growth, and November’s reading had been 0.3%.
This reading was too hot for investors, who forthrightly sold out of equities. It was yet another example of the market treating positive economic news as bad for share prices. This is because investors believe that positive economic figures reduce the likelihood that the Fed will begin cutting interest rates on the market’s schedule.
Heading into the release, the market greatly bet on cuts at both the March and May Federal Open Market Committee (FOMC) meetings. But following US Retail Sales, the odds that the central banks keeps rates constant at 5.25% to 5.50% at the March meeting rose from 35% to 43%, according to data from the CME Group’s FedWatch Tool. Likewise, the odds that May’s FOMC meeting will see a fed funds range 50 basis points below the current level (4.75% to 5.00%) fell from 59% to 15%.
Tuesday’s comments from Fed Governor Christopher Waller didn’t help sentiment either. Waller said there was no need for the central bank to cut rates at a hasty pace and should instead take a wait-and-see approach. Those comments were in line with December’s Dot Plot, which called for 75 basis points of cuts in 2024. The market surged in December owing to a market consensus for 150 basis points of cuts, and now that optimism is getting reined in.
The fact that fewer rate cuts are now being priced into stock market models for the year means that US Treasuries are selling off, pushing up yields. Wednesday saw the second straight day of yields rising more than 2%. The 2-year bond yield even rose 3% at one point in the session. Of course, rising yields often travel in the opposite direction of stock prices, and that is the case here.
Dow unable to benefit from recent earnings of index components
The Dow Jones index only has 30 stocks, so every earnings call from a component usually has an outsized effect. The start of this earnings season has been overshadowed by the total focus on interest rates, but three major index holdings have reported results for Q4.
JPMorgan (JPM) got things going last Friday with adjusted earnings per share (EPS) of $3.97, up from $3.57 one year ago and beating consensus expectations of $3.61. Revenue of $38.6 billion missed consensus by more than $1.2 billion. Overall, revenue rose nearly 12% from a year ago, and the community banking division was lauded for driving most of those gains.
UnitedHealth Group (UNH), which comprises about 10% of the Dow index and remains its largest holding, also posted Q4 results last Friday. The insurer said healthcare costs rose more than expected in the quarter but was still able to beat consensus for EPS and revenue by a small margin. Revenue rose 14% YoY, and the company reaffirmed its 2024 guidance once again.
Goldman Sachs (GS), which comprises about 7% of the Dow Jones, absolutely destroyed consensus estimates for the fourth quarter when it posted results on Tuesday. GAAP EPS of $5.48 beat analyst forecasts by $1.55, and the revenue consensus was bested by $360 million. Management praised its wealth management unit for the better than expected performance.
Analysts aren’t as optimistic about Travelers, a smaller component of the Dow that reports on Friday. All 19 analysts who altered their estimates for Q4 have cut their earnings outlook. The commercial and property insurer is expected to post adjusted earnings of $5.06 on revenue of $9.95 billion.
Dow Jones FAQs
What is the Dow Jones?
The Dow Jones Industrial Average, one of the oldest stock market indices in the world, is compiled of the 30 most traded stocks in the US. The index is price-weighted rather than weighted by capitalization. It is calculated by summing the prices of the constituent stocks and dividing them by a factor, currently 0.152. The index was founded by Charles Dow, who also founded the Wall Street Journal. In later years it has been criticized for not being broadly representative enough because it only tracks 30 conglomerates, unlike broader indices such as the S&P 500.
What factors impact the Dow Jones Industrial Average?
Many different factors drive the Dow Jones Industrial Average (DJIA). The aggregate performance of the component companies revealed in quarterly company earnings reports is the main one. US and global macroeconomic data also contributes as it impacts on investor sentiment. The level of interest rates, set by the Federal Reserve (Fed), also influences the DJIA as it affects the cost of credit, on which many corporations are heavily reliant. Therefore, inflation can be a major driver as well as other metrics which impact the Fed decisions.
What is Dow Theory?
Dow Theory is a method for identifying the primary trend of the stock market developed by Charles Dow. A key step is to compare the direction of the Dow Jones Industrial Average (DJIA) and the Dow Jones Transportation Average (DJTA) and only follow trends where both are moving in the same direction. Volume is a confirmatory criteria. The theory uses elements of peak and trough analysis. Dow’s theory posits three trend phases: accumulation, when smart money starts buying or selling; public participation, when the wider public joins in; and distribution, when the smart money exits.
How can I trade the DJIA?
There are a number of ways to trade the DJIA. One is to use ETFs which allow investors to trade the DJIA as a single security, rather than having to buy shares in all 30 constituent companies. A leading example is the SPDR Dow Jones Industrial Average ETF (DIA). DJIA futures contracts enable traders to speculate on the future value of the index and Options provide the right, but not the obligation, to buy or sell the index at a predetermined price in the future. Mutual funds enable investors to buy a share of a diversified portfolio of DJIA stocks thus providing exposure to the overall index.
Dow Jones Industrial Average forecast
The Dow Jones Industrial Average dropped below the 21-day Simple Moving Average (SMA) on Tuesday, and the index continued in that fashion on Wednesday. The DJIA price action has closed above the 21-day SMA in every session since November 1, so this is a big deal and probably signals that a bearish reversal is in motion. It also looks like a downswing is in motion for the DJIA since a lower low has been reached by the close on Wednesday compared with the January 8 low.
The DJIA may find support in the 36,500 to 36,952 former resistance range stemming from late 2021. A break of 36,500, however, would induce a further sell-off likely to make its way to another former resistance zone sitting in the mid-35,000s.
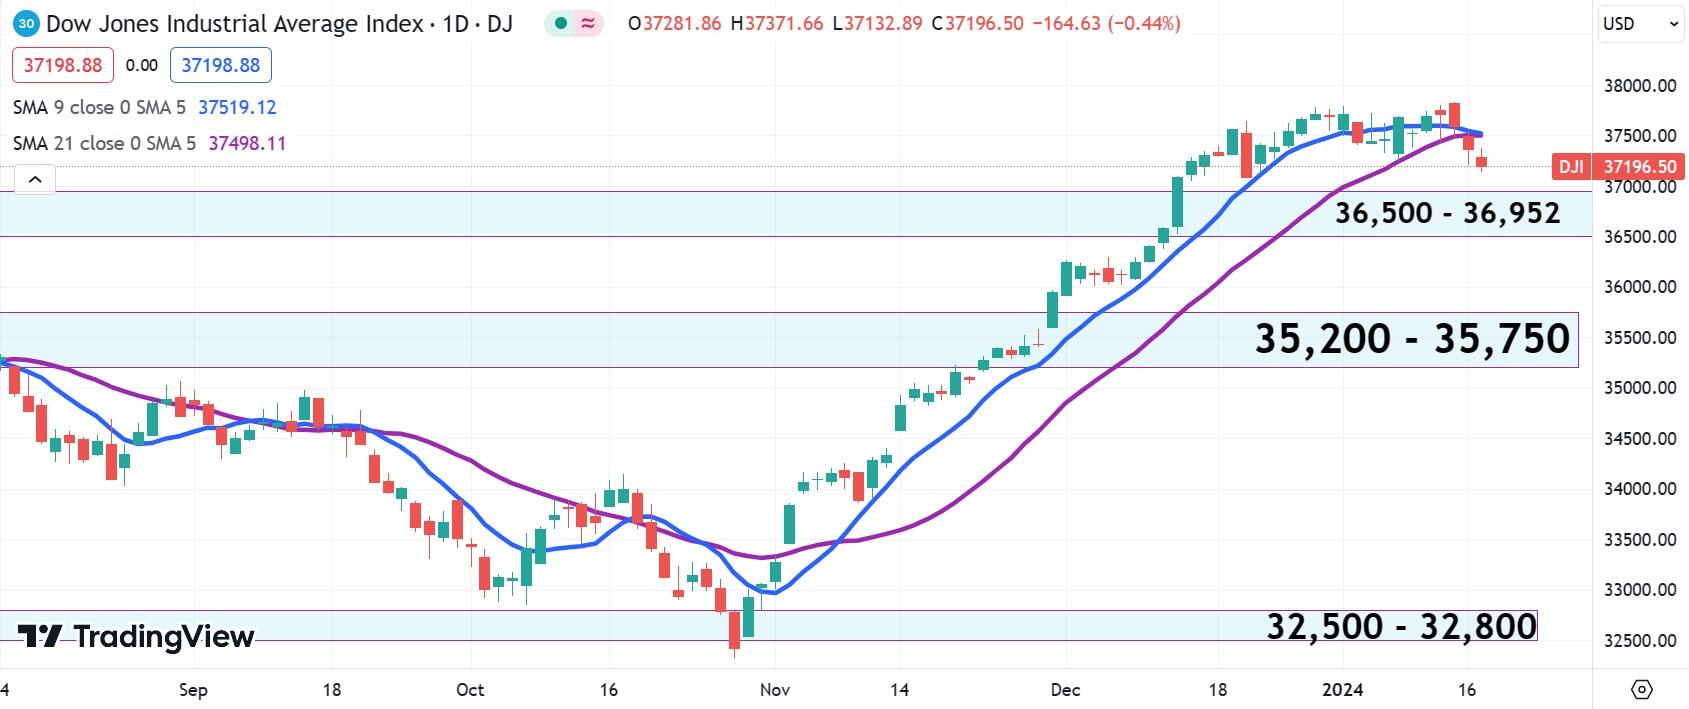
Dow Jones Industrial Average daily chart
Premium
You have reached your limit of 3 free articles for this month.
Start your subscription and get access to all our original articles.
Author

Clay Webster
FXStreet
Clay Webster grew up in the US outside Buffalo, New York and Lancaster, Pennsylvania. He began investing after college following the 2008 financial crisis.


