- Barrel bids tested into fresh peaks on Wednesday, but remain subdued.
- With US markets dark for Wednesday's holiday, market flows and volatility remain thin.
- An extended uptick in US Crude Oil supplies could dampen the mood.
West Texas Intermediate (WTI) US Crude Oil tested into fresh Wednesday highs on thin volume, clipping $81.00 per barrel as commodities drift softly higher despite US exchanges shuttered for the Juneteenth holiday. WTI found a new seven-week high and is on pace to extend into a second straight week of gain as Crude Oil recovers from a recent swing low, but bolstered energy market hopes of a summertime upswing in energy demand could slump again if US Crude Oil production continues to outpace draws.
The American Petroleum Institute (API) reported another week-on-week increase in US Weekly Crude Oil Stocks this week, adding another 2.264 million barrels to counts and eating away at the previous week’s -2.428 million barrel decline as US production of Crude Oil continues to overhang on current demand levels.
The Organization of the Petroleum Exporting Countries (OPEC) and its extended network of non-ally countries, OPEC+ is on pace to end voluntary production cuts later in the year that were meant to bolster global Crude Oil prices by crimping production. However, OPEC+ nations that rely on Crude Oil output to balance their government budgets are buckling under the pressure and pumping caps are set to begin phasing out in the third quarter.
Recent demand figures from China also disappointed energy markets, however, barrel traders are pivoting to hope for an ambiguous expected uptick in summertime energy demand to press down on current oversupply. The Energy Information Administration (EIA) will be publishing its own week-on-week barrel counts on Thursday, and barrel traders are hoping for a -2.0 million barrel drawdown for the week ended June 14 after the previous week’s 3.73 million barrel buildup.
WTI technical outlook
WTI US Crude Oil has temporarily halted a technical recovery from the last major swing low into $72.45. WTI has closed in the green for all but four of the last eleven consecutive trading days, and has managed to crack north of the 200-day Exponential Moving Average (EMA) at $78.84. Slack in bullish momentum could pull US Crude Oil back below the 200-day EMA and send WTI into another leg lower, pushing bids back below a descending trendline drawn from 2024’s peak bids around $87.00 per barrel.
WTI daily chart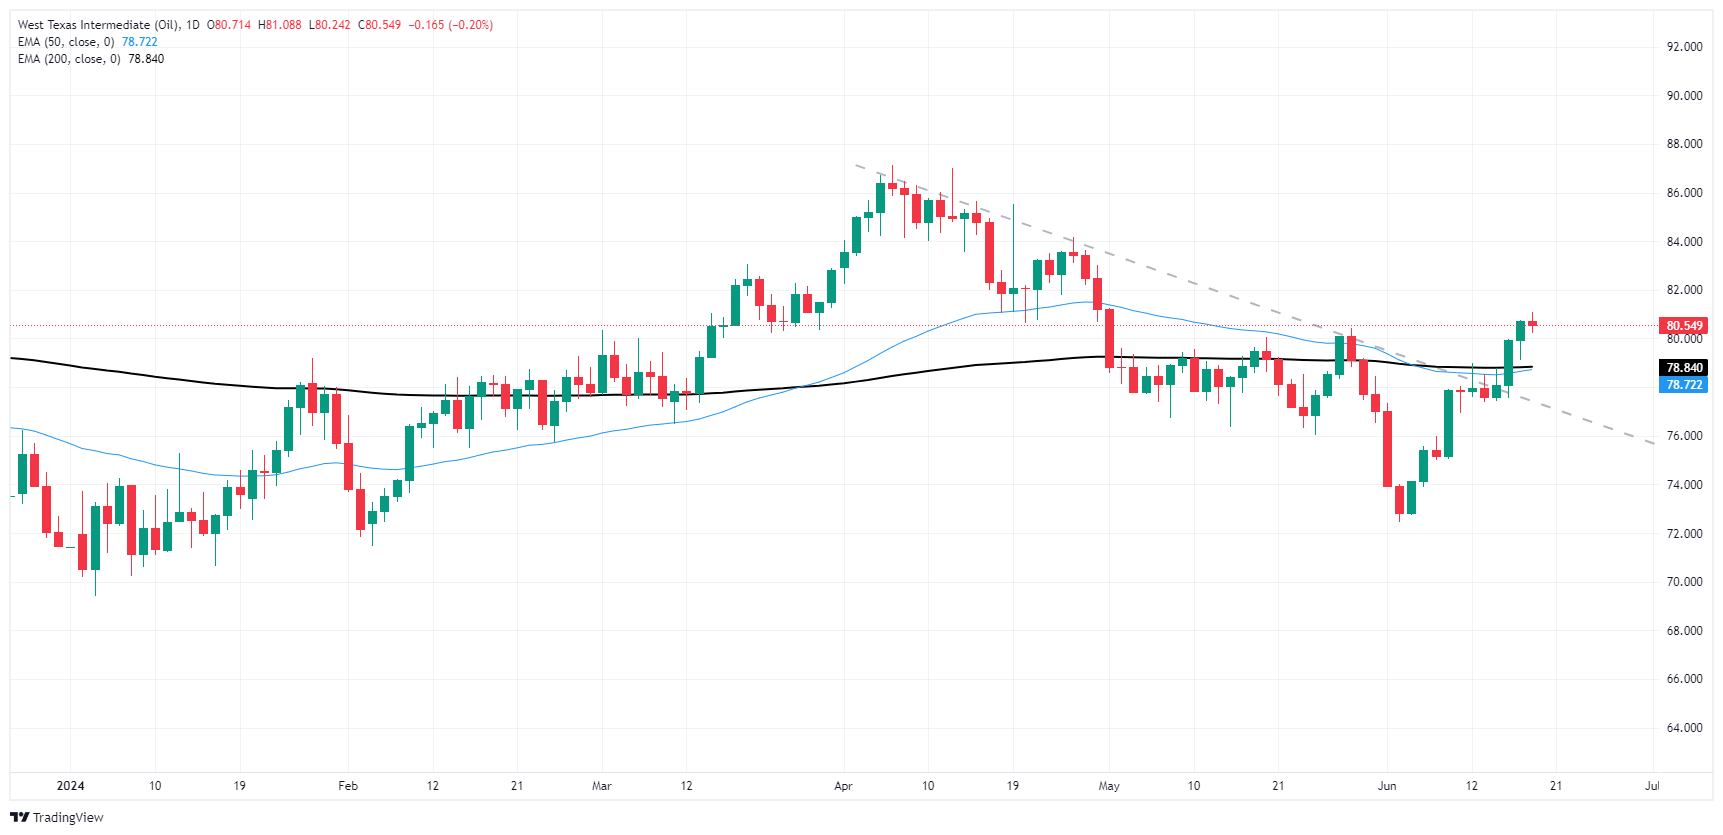
WTI Oil FAQs
WTI Oil is a type of Crude Oil sold on international markets. The WTI stands for West Texas Intermediate, one of three major types including Brent and Dubai Crude. WTI is also referred to as “light” and “sweet” because of its relatively low gravity and sulfur content respectively. It is considered a high quality Oil that is easily refined. It is sourced in the United States and distributed via the Cushing hub, which is considered “The Pipeline Crossroads of the World”. It is a benchmark for the Oil market and WTI price is frequently quoted in the media.
Like all assets, supply and demand are the key drivers of WTI Oil price. As such, global growth can be a driver of increased demand and vice versa for weak global growth. Political instability, wars, and sanctions can disrupt supply and impact prices. The decisions of OPEC, a group of major Oil-producing countries, is another key driver of price. The value of the US Dollar influences the price of WTI Crude Oil, since Oil is predominantly traded in US Dollars, thus a weaker US Dollar can make Oil more affordable and vice versa.
The weekly Oil inventory reports published by the American Petroleum Institute (API) and the Energy Information Agency (EIA) impact the price of WTI Oil. Changes in inventories reflect fluctuating supply and demand. If the data shows a drop in inventories it can indicate increased demand, pushing up Oil price. Higher inventories can reflect increased supply, pushing down prices. API’s report is published every Tuesday and EIA’s the day after. Their results are usually similar, falling within 1% of each other 75% of the time. The EIA data is considered more reliable, since it is a government agency.
OPEC (Organization of the Petroleum Exporting Countries) is a group of 13 Oil-producing nations who collectively decide production quotas for member countries at twice-yearly meetings. Their decisions often impact WTI Oil prices. When OPEC decides to lower quotas, it can tighten supply, pushing up Oil prices. When OPEC increases production, it has the opposite effect. OPEC+ refers to an expanded group that includes ten extra non-OPEC members, the most notable of which is Russia.
Information on these pages contains forward-looking statements that involve risks and uncertainties. Markets and instruments profiled on this page are for informational purposes only and should not in any way come across as a recommendation to buy or sell in these assets. You should do your own thorough research before making any investment decisions. FXStreet does not in any way guarantee that this information is free from mistakes, errors, or material misstatements. It also does not guarantee that this information is of a timely nature. Investing in Open Markets involves a great deal of risk, including the loss of all or a portion of your investment, as well as emotional distress. All risks, losses and costs associated with investing, including total loss of principal, are your responsibility. The views and opinions expressed in this article are those of the authors and do not necessarily reflect the official policy or position of FXStreet nor its advertisers. The author will not be held responsible for information that is found at the end of links posted on this page.
If not otherwise explicitly mentioned in the body of the article, at the time of writing, the author has no position in any stock mentioned in this article and no business relationship with any company mentioned. The author has not received compensation for writing this article, other than from FXStreet.
FXStreet and the author do not provide personalized recommendations. The author makes no representations as to the accuracy, completeness, or suitability of this information. FXStreet and the author will not be liable for any errors, omissions or any losses, injuries or damages arising from this information and its display or use. Errors and omissions excepted.
The author and FXStreet are not registered investment advisors and nothing in this article is intended to be investment advice.
Recommended content
Editors’ Picks
EUR/USD drops below 1.0700 ahead of key US PCE inflation

EUR/USD is back in the red below 1.0700 in the early European morning on Friday. The pair reverses the previous rebound amid resurgent US Dollar demand even as risk sentiment remains in a sweeter spot. Markets turn anxious ahead of US PCE inflation and Sunday's French elections.
GBP/USD remains vulnerable near monthly low, US PCE data awaited

GBP/USD attracts fresh sellers on Friday, though the downside remains cushioned. Traders now seem reluctant to place aggressive directional bets ahead of the US PCE. The technical setup suggests that the path of least resistance remains to the downside.
Gold sellers refuse to give up, as US PCE inflation looms

Gold price has snapped its rebound from two-week lows early Friday, losing ground after running into offers near the $2,330 resistance again. The next direction for Gold price now remains in the hands of the US Personal Consumption Expenditure inflation data.
Top 3 Price Prediction Bitcoin, Ethereum, Ripple: BTC struggles around the $62,000 level

Bitcoin price faces pullback resistance at the lower band of the descending wedge around $62,000. Ethereum price finds support at $3,288, the 61.8% Fibonacci retracement level. Ripple price faces resistance at $0.500, its daily resistance level.
Friday calendar stacked with first-tier data

Key standouts on Friday’s calendar come from German import prices, UK GDP, German unemployment, Canada GDP, US core PCE, personal income, personal spending, Michigan sentiment, Chicago PMIs, and Fedspeak.