British Pound ticks down against US Dollar ahead of key US economic releases
- The British Pound ticks lower against the US Dollar ahead of the US flash Q3 GDP and PCE inflation data.
- The US economy is expected to have expanded at a stronger pace of 3.2% in the July-September period.
- Investors are confident that the Fed and the BoE will hike interest rates in their upcoming policy meetings.


The British Pound (GBP) edges down to near 1.3312 against the US Dollar (USD) during the European trading session on Thursday. The GBP/USD pair ticks lower as the US Dollar (USD) regains ground, with financial markets remaining confident of Federal Reserve’s (Fed) interest rate hike in December after leaving them steady in the policy meeting on Wednesday.
As of writing, the US Dollar Index (DXY), which gauges the Greenback’s value against six major currencies, trades slightly higher to near 102.20. The USD Index corrected on Wednesday after a three-day winning streak.
Analysts at MUFG/BTMU note that the Fed left the fed funds rate unchanged at "3.75–4.00%", a widely anticipated pause following September’s hike, but stress that the decision "included two dissents in favour of another rate increase," underscoring lingering hawkishness on the committee. They highlight that Fed Chair Warsh "reiterated the Fed’s commitment to returning inflation to 2%".
MUFG/BTMU add that "markets continue to price around an 87% probability of a December rate hike," indicating that investors still expect further action this year.
On the economic data front, investors await the United States (US) flash Q3 Gross Domestic Product (GDP) and Personal Consumption Expenditure (PCE) Price Index data for September, which will be published at 12:30 GMT.
According to estimates, the US economy grew at an annualized pace of 3.2%, faster than the previous reading of 2.2%. The core PCE Inflation, which is Fed’s preferred inflation gauge, is seen higher at 3.1% Year-on-Year (YoY) from the previous reading of 3%.
On the UK front, investors await the Bank of England’s (BoE) monetary policy decision, which will be announced next week. The BoE is almost certain to hike interest rates by 25 basis points (bps) to 4%.
GBP/USD Technical Analysis
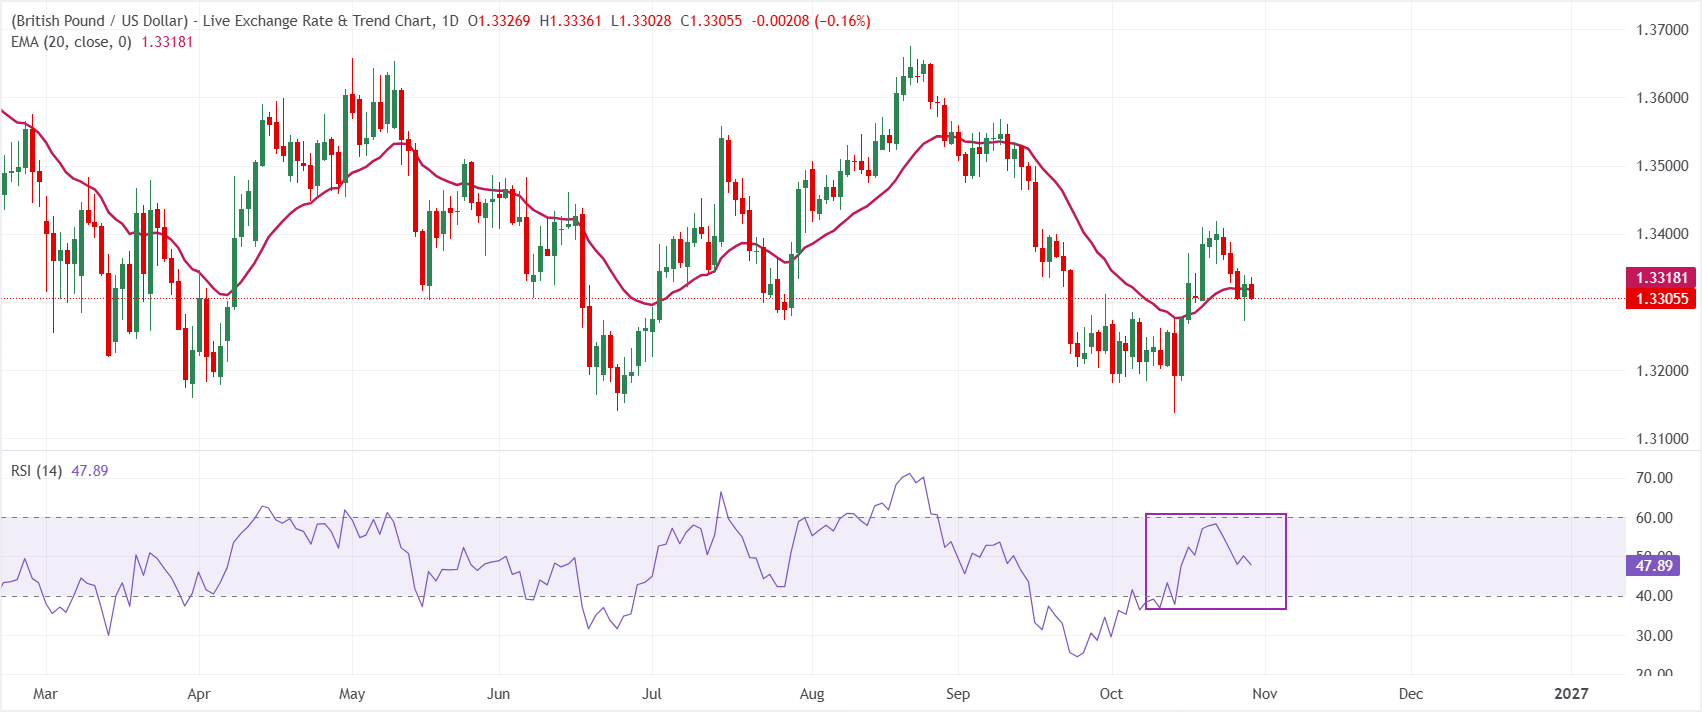
In the daily chart, GBP/USD trades at 1.3307, retaining a mildly bearish near-term bias as spot holds just beneath the 20-day exponential moving average (EMA) at 1.3318. Price location below this short-term EMA suggests the latest rebound remains capped by nearby dynamic resistance, while the Relative Strength Index (RSI) around 48 hints at consolidative rather than trending momentum, leaving the pair vulnerable as long as it fails to reclaim the 1.3318 barrier.
On the topside, immediate resistance is defined by the 20-day EMA at 1.3318; a sustained break above this level would ease downside pressure and open the way for a broader recovery. With no clear support indicators in the current dataset, traders may look to recent price lows on the chart for reference, but the technical focus stays on whether GBP/USD can overcome the 1.3318 cap to negate the current bearish tone.
(The technical analysis of this story was written with the help of an AI tool. Know more.)
Economic Indicator
Gross Domestic Product Annualized
The real Gross Domestic Product (GDP) Annualized, released quarterly by the US Bureau of Economic Analysis, measures the value of the final goods and services produced in the United States in a given period of time. Changes in GDP are the most popular indicator of the nation’s overall economic health. The data is expressed at an annualized rate, which means that the rate has been adjusted to reflect the amount GDP would have changed over a year’s time, had it continued to grow at that specific rate. Generally speaking, a high reading is seen as bullish for the US Dollar (USD), while a low reading is seen as bearish.
Read more.Next release: Thu Oct 29, 2026 12:30 (Prel)
Frequency: Quarterly
Consensus: 3.2%
Previous: 2.2%
Source: US Bureau of Economic Analysis
The US Bureau of Economic Analysis (BEA) releases the Gross Domestic Product (GDP) growth on an annualized basis for each quarter. After publishing the first estimate, the BEA revises the data two more times, with the third release representing the final reading. Usually, the first estimate is the main market mover and a positive surprise is seen as a USD-positive development while a disappointing print is likely to weigh on the greenback. Market participants usually dismiss the second and third releases as they are generally not significant enough to meaningfully alter the growth picture.
Author
Sagar Dua
FXStreet
Sagar Dua is associated with the financial markets from his college days. Along with pursuing post-graduation in Commerce in 2014, he started his markets training with chart analysis.

















