Bovespa Index Elliott Wave technical analysis [Video]
![Bovespa Index Elliott Wave technical analysis [Video]](https://editorial.fxstreet.com/images/Markets/Equities/Bovespa/bm-amp-f-75135517_XtraLarge.jpg)
Bovespa Index Elliott Wave analysis
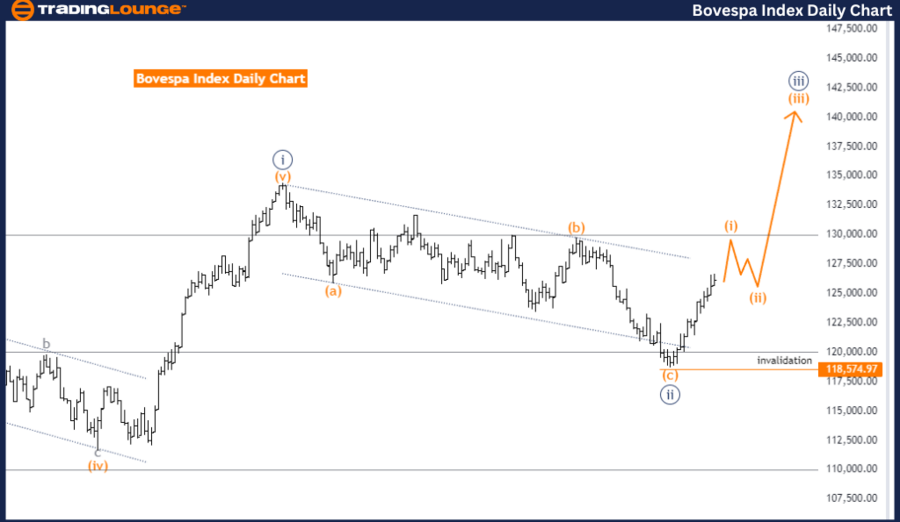
Bovespa Index Elliott Wave Technical Analysis - Day Chart
Trend: Impulsive.
Structure: Orange wave 1.
Position: Navy blue wave 3.
Next lower degrees: Orange wave 2.
Details: Orange wave C of 2 appears complete, now orange wave 1 of 3 is in play.
Wave cancel invalid level: 118574.97.
The Bovespa Index Elliott Wave Analysis for the day chart provides insights into the current trend and wave structure of the Brazilian stock market. The analysis focuses on understanding the market's trend direction, which is identified as impulsive. This indicates a strong, directional move within the market, suggesting a continuation of the trend rather than a temporary correction.
Wave structure analysis
-
The specific wave structure being analyzed is orange wave 1, signifying the beginning of a new trend cycle. This wave is part of a larger sequence and marks the initial stage of a potentially significant upward movement.
-
The current position within this wave sequence is navy blue wave 3. This implies that the market is in the third wave of a higher degree sequence, indicating a robust continuation of the upward trend. The third wave is typically the most powerful and extended wave in Elliott Wave theory, suggesting strong market momentum.
Future direction
-
Looking ahead, the direction in the next lower degrees points towards orange wave 2. Once the current impulsive move (orange wave 1) concludes, the market is expected to undergo a corrective phase represented by orange wave 2. This correction will likely be a temporary pullback before the trend resumes with orange wave 3.
-
The analysis details that orange wave C of 2 appears to be complete, indicating the end of the previous corrective phase. Now, orange wave 1 of 3 is in play, marking the start of a new impulsive move within the larger trend.
Key level
- The wave cancel invalid level is set at 118574.97. This level is crucial for maintaining the validity of the current wave structure. If the market surpasses this threshold, the existing wave count would be invalidated, necessitating a re-evaluation and potential re-labeling of the wave counts.
In summary, the Bovespa Index day chart is in an impulsive trend with orange wave 1 currently unfolding as part of navy blue wave 3. The analysis anticipates a corrective phase with orange wave 2 after the completion of the current wave. The wave cancel invalid level is 118574.97, which is essential for the integrity of the current Elliott Wave analysis. This analysis highlights the ongoing impulsive trend and the potential for a corrective phase in the near future.
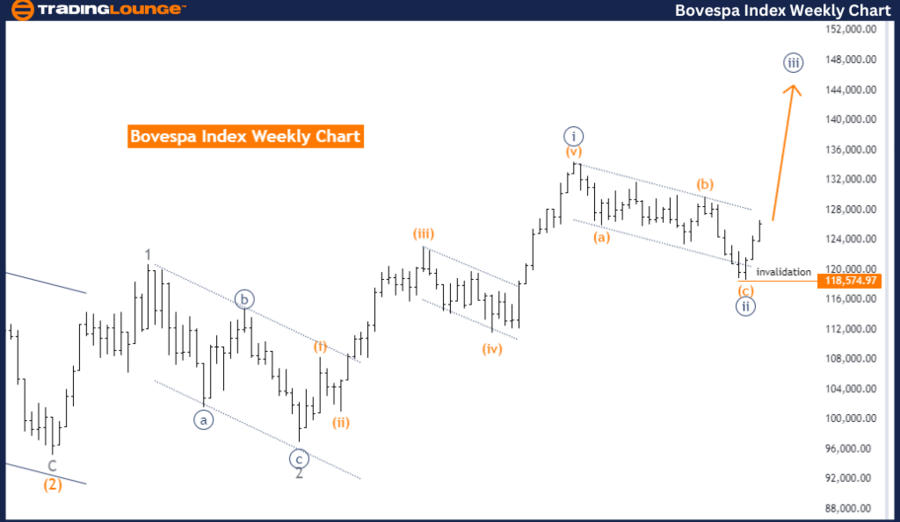
Bovespa Index Elliott Wave technical analysis - Weekly chart
Trend: Impulsive.
Structure: Navy blue wave 3.
Position: Gray wave 3.
Next Higher Degrees: Navy blue wave 3 (started).
Details: Navy blue wave 2 appears complete, now navy blue wave 3 is in play.
Wave cancel invalid level: 118574.97.
The Bovespa Index Elliott Wave Analysis for the weekly chart focuses on understanding the current trend and wave structure of the Brazilian stock market. The primary function of this analysis is to identify and follow the trend, which is classified as impulsive. An impulsive mode suggests a strong, directional move that is likely to continue in the same direction.
Wave structure analysis
-
The specific wave structure being analyzed is navy blue wave 3, indicating that the market is in the third wave of a higher degree sequence. Within this broader wave, the current position is gray wave 3. This suggests that the market is experiencing a significant upward movement within the larger impulsive trend.
-
The analysis indicates that the market has already completed navy blue wave 2. This previous wave represents a corrective phase that typically follows an initial impulsive move. With navy blue wave 2 now completed, the market has transitioned into navy blue wave 3. This wave is generally the most powerful and extended wave in Elliott Wave theory, indicating strong market momentum and a continuation of the upward trend.
Future direction
-
The direction in the next higher degrees points to the continuation of navy blue wave 3. This suggests that the market's current upward movement is expected to persist, reinforcing the ongoing impulsive trend.
-
The wave cancel invalid level is set at 118574.97. This level is crucial for maintaining the validity of the current wave structure. If the market surpasses this threshold, the existing wave count would be invalidated, necessitating a re-evaluation and potential re-labeling of the wave counts.
In summary, the Bovespa Index weekly chart is in an impulsive trend with navy blue wave 3 currently unfolding as part of gray wave 3. The analysis indicates that navy blue wave 2 has been completed, and the market is now in navy blue wave 3, suggesting a strong continuation of the upward trend. The wave cancel invalid level is 118574.97, which is essential for the integrity of the current Elliott Wave analysis. This analysis highlights the ongoing impulsive trend.
Bovespa Index Elliott Wave technical analysis [Video]
Author

Peter Mathers
TradingLounge
Peter Mathers started actively trading in 1982. He began his career at Hoei and Shoin, a Japanese futures trading company.


