Uniswap Price Forecast: UNI rally gains momentum amid growing retail demand, RWA DEX volume
- Uniswap extends its breakout, up more than 10% on Tuesday to $5.84.
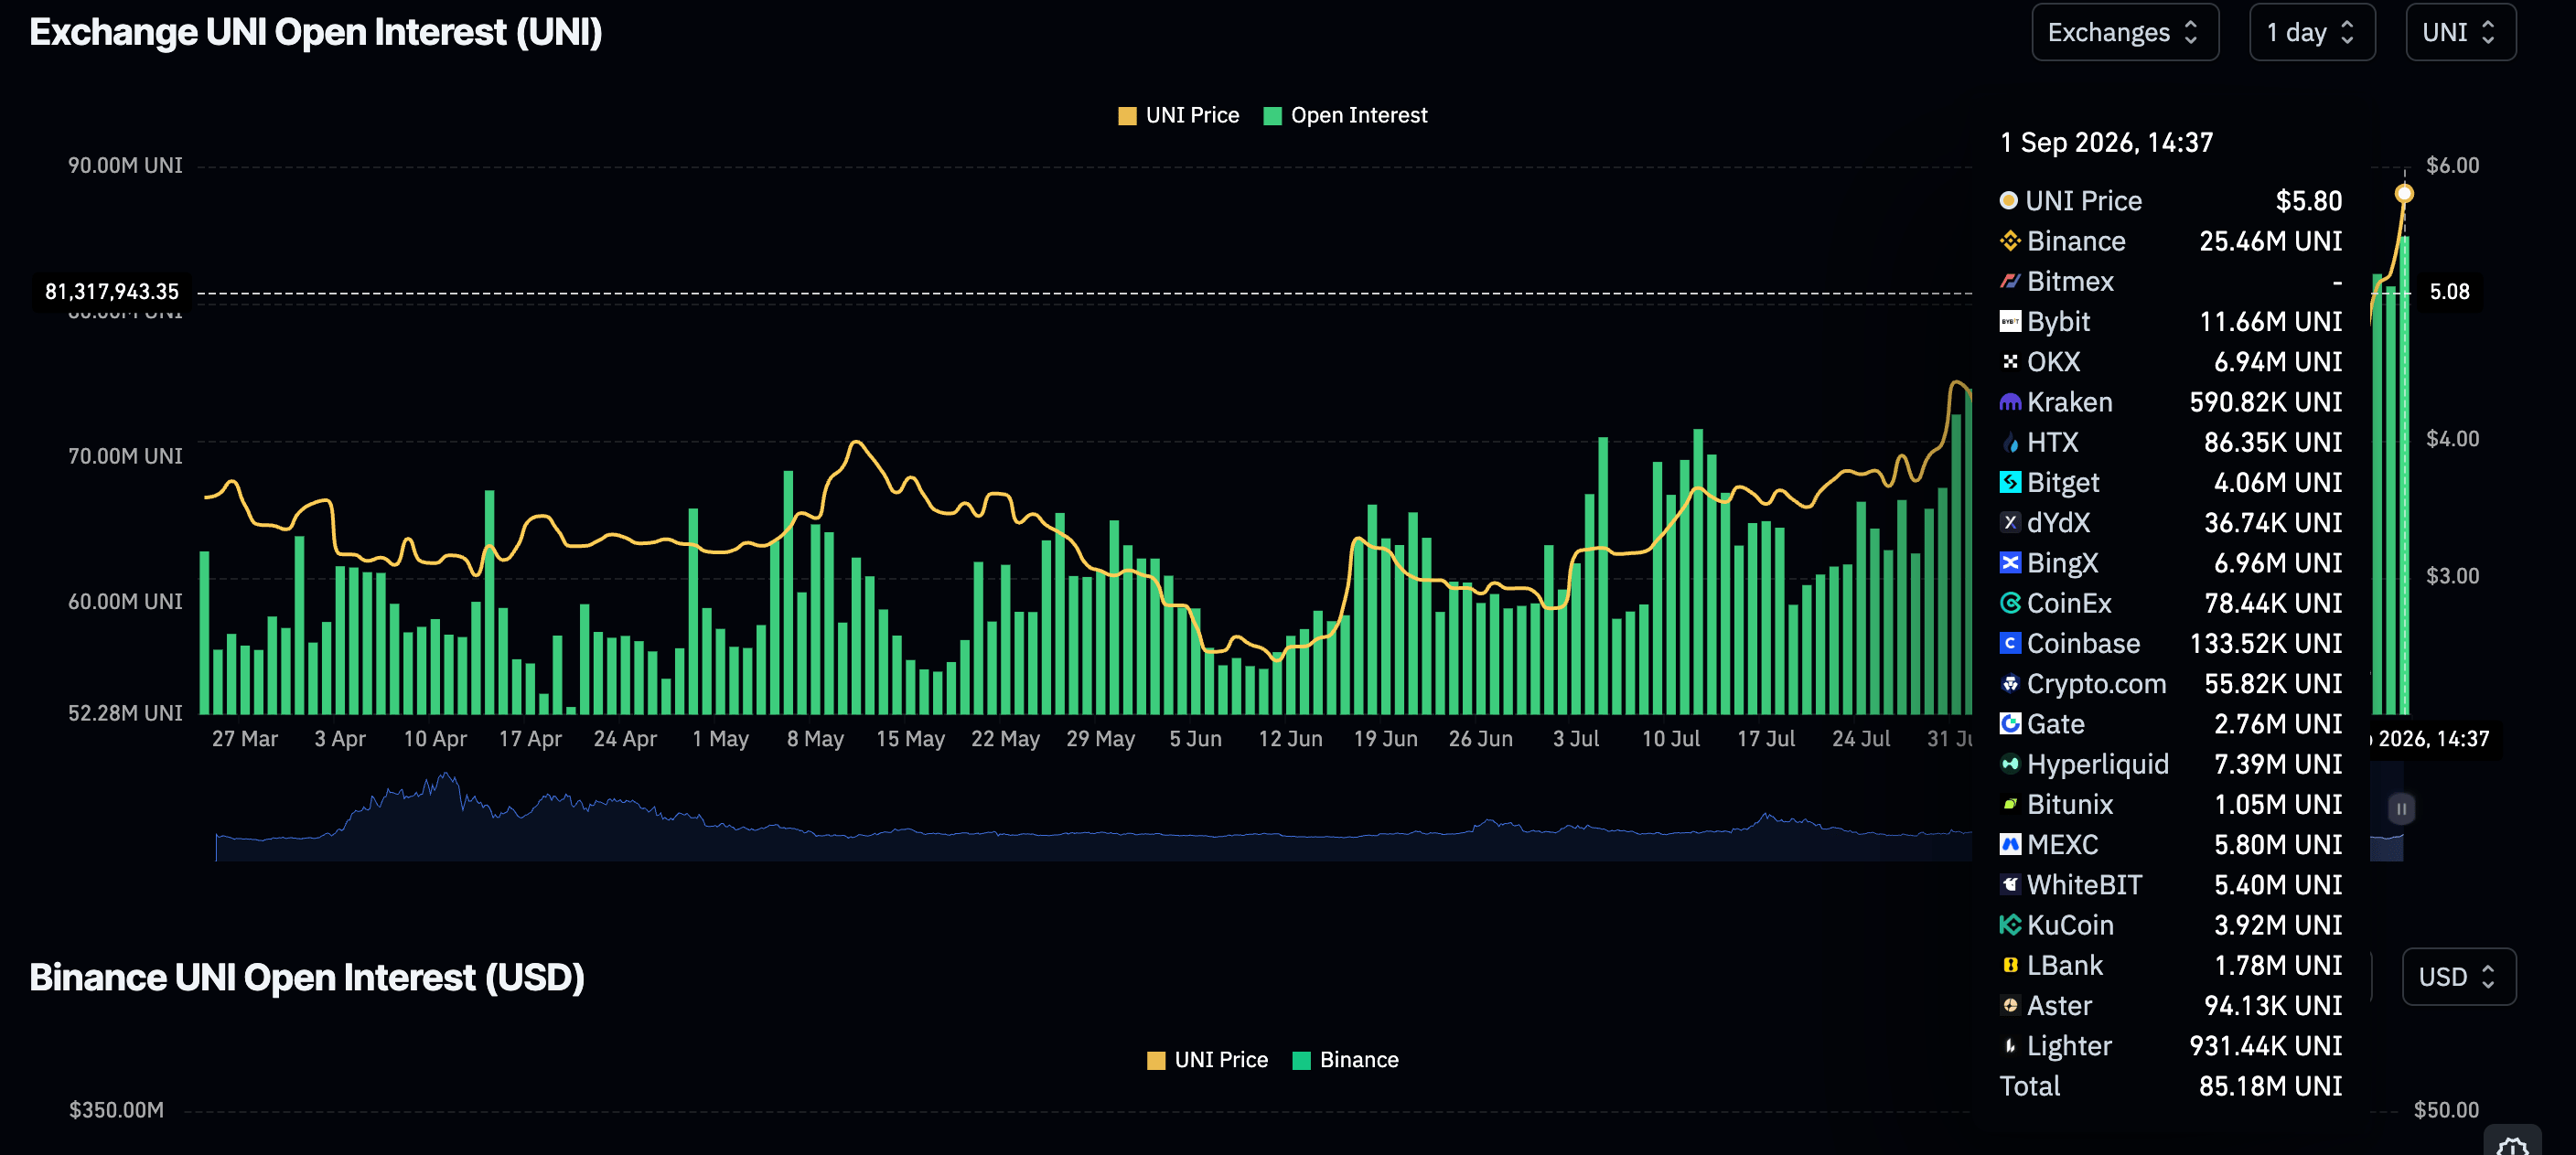
- Derivatives remain bullish, with futures Open Interest climbing to 85 million UNI.
- Uniswap reports a 20% weekly increase in all Real-World Assets volume passing through the protocol.

Uniswap (UNI) maintains a firm bullish outlook, trading at $5.84, up more than 10% on Tuesday. The decentralized exchange (DEX) native token has marked four straight days of gains, underpinning a robust technical structure. A breakout above $6.00 could help affirm bullish control, while consolidation below that level may encourage profit-taking and raise the odds of a correction.
Uniswap dominates RWA DEX volume
Uniswap has continued to dominate real-world assets (RWA) trading volume at 60% last week, up from 40% the previous week. The self-reported stats indicate growing user engagement and a shift to DEX exchanges for RWA transactions.
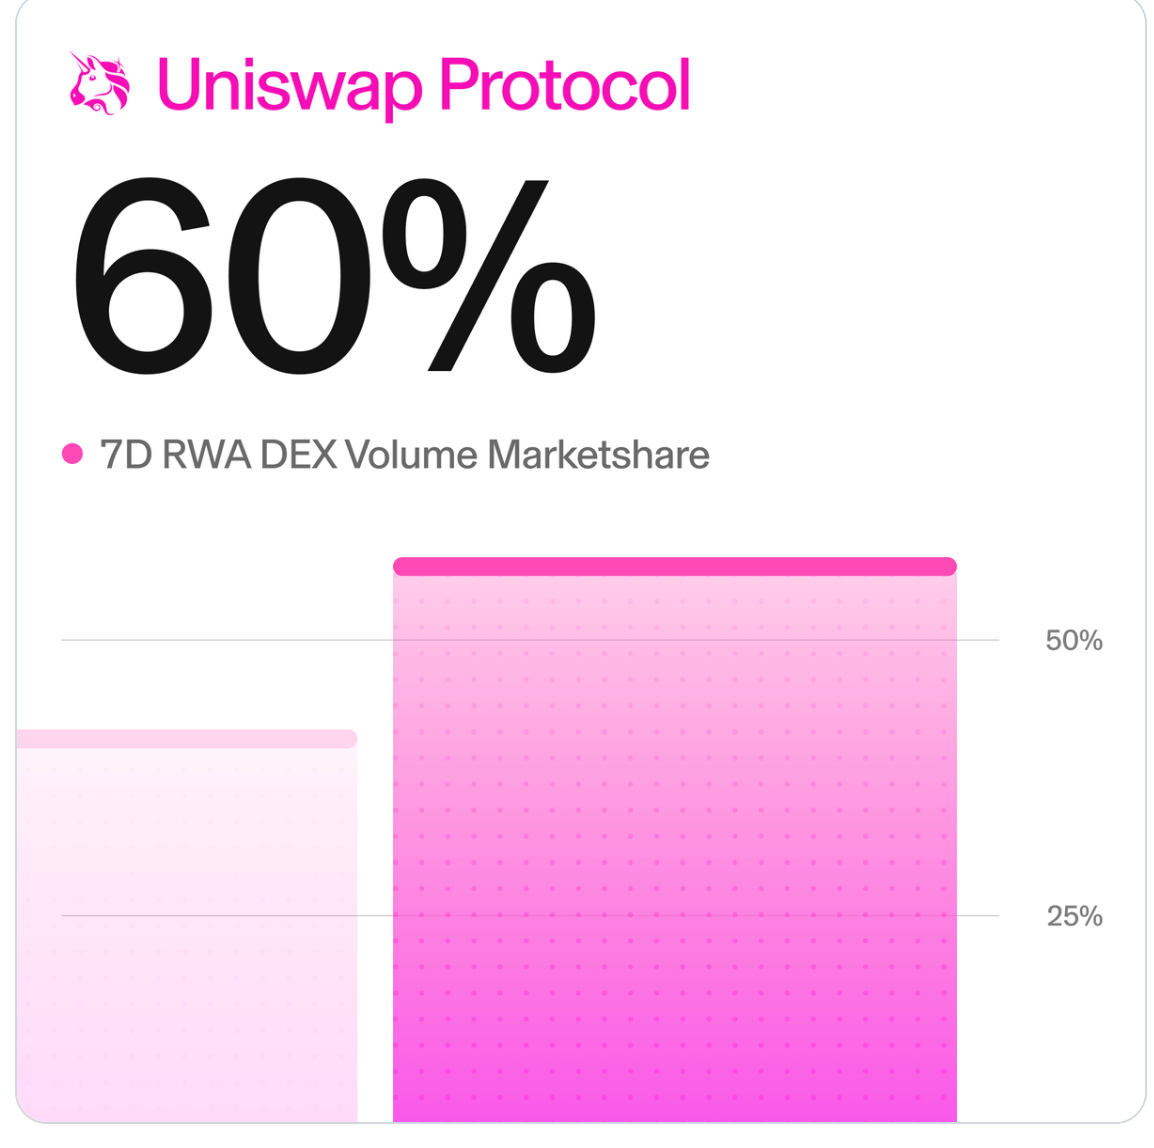
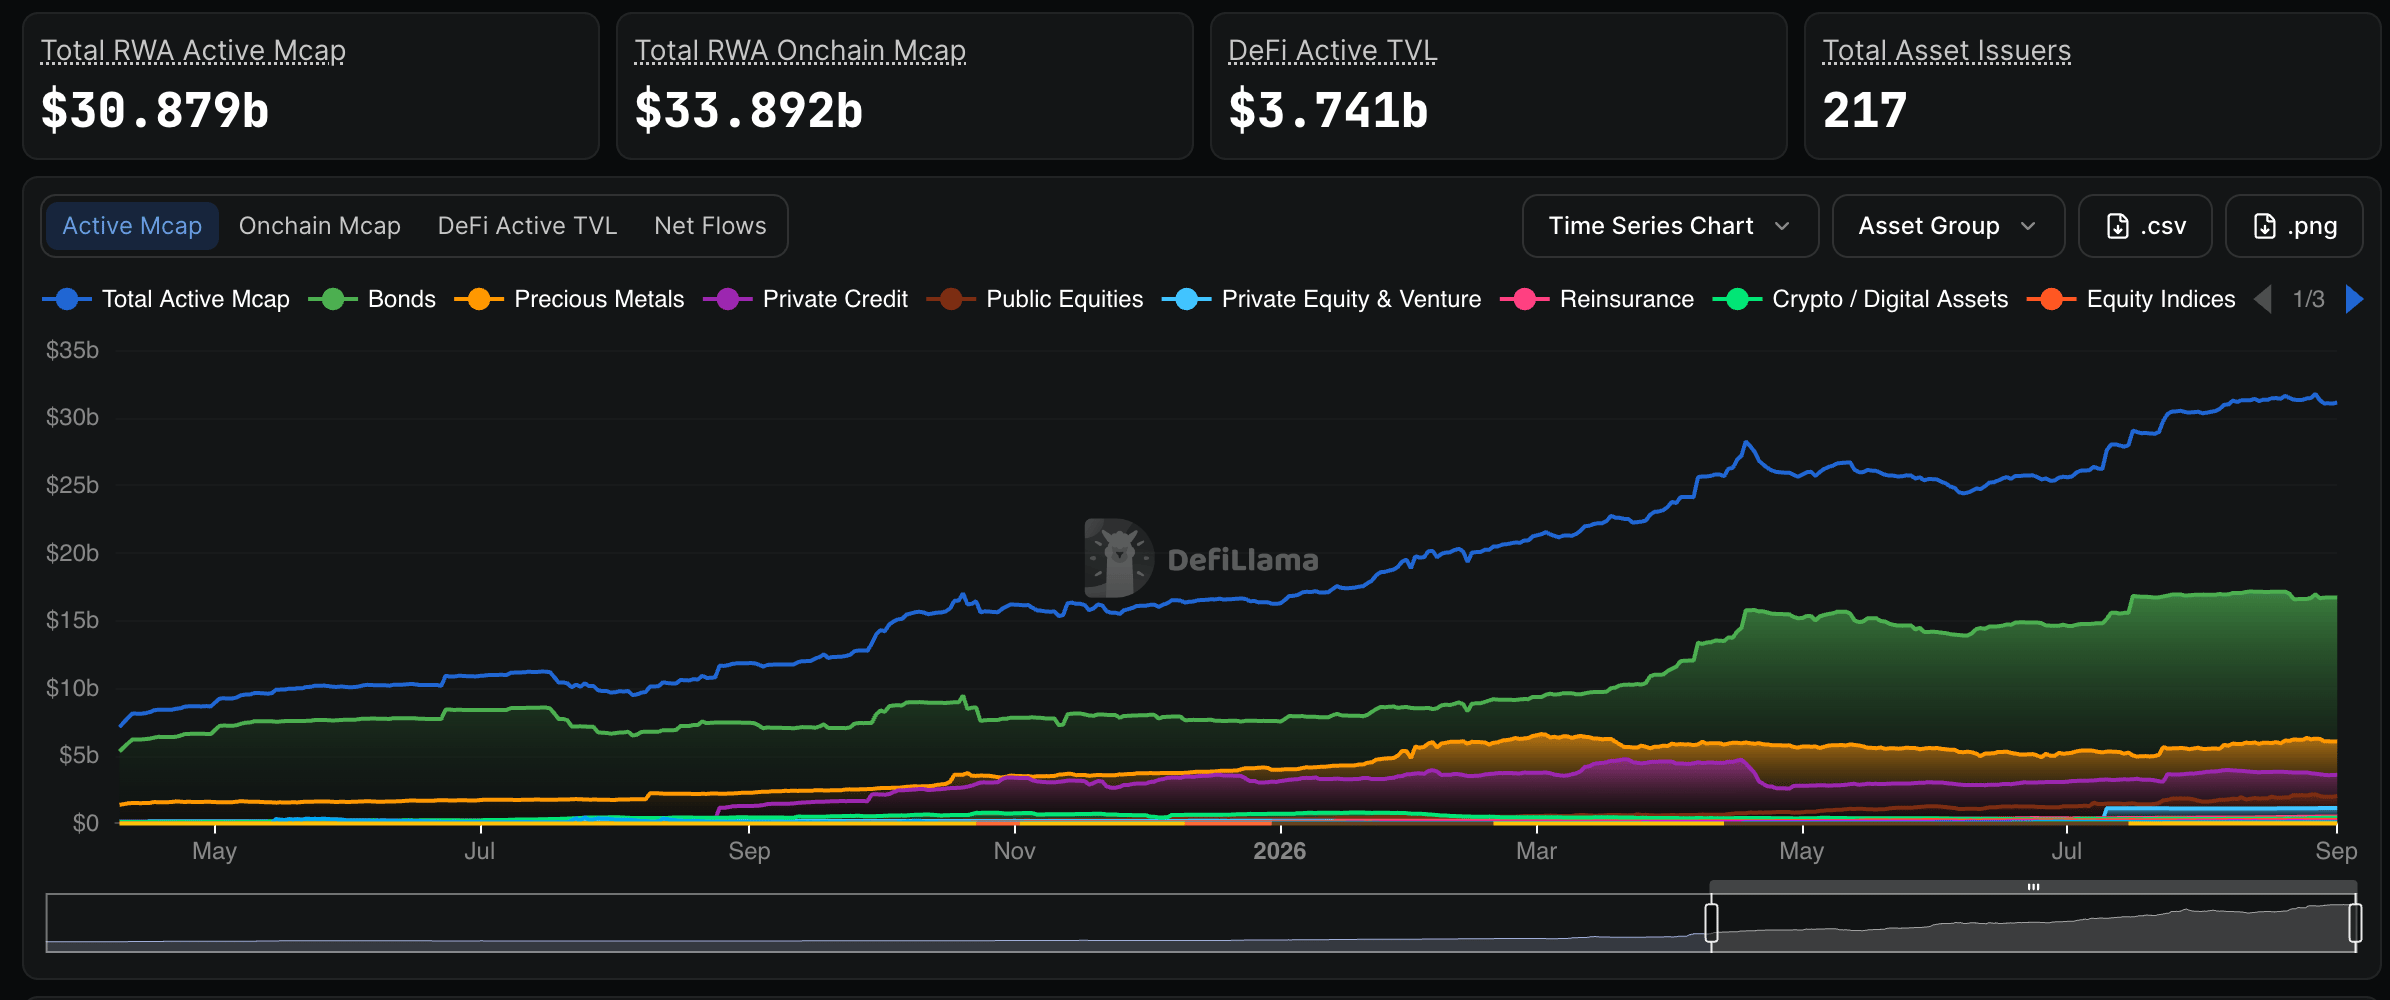
The volume increase matches growth in the broader RWA sector, with an active market cap of $31 billion across 217 assets, according to DefiLlama. If Uniswap continues to dominate the RWA sector, it will provide a strong tailwind to support an extended uptrend.
Meanwhile, the derivatives market shows signs of steady growth, with Open Interest (OI) rising to 85 million UNI on Tuesday, up from 82 million the day before and 72 million last Saturday. This supports UNI’s bullish outlook as bulls aim for a breakout above $6.00.
Technical analysis: Uniswap bulls stay in control
Uniswap trades at $5.84, extending a robust bullish phase after reclaiming all major Exponential Moving Averages (EMAs), suggesting a firmly supported upside structure. The downward resistance trendline, broken near $3.89, has turned into an additional underlying base, while the Relative Strength Index (RSI) at 78 signals overbought conditions.
At the same time, the Moving Average Convergence Divergence (MACD) upholds a bullish histogram, reinforcing strong upward momentum but hinting that the advance may be stretched in the near term.
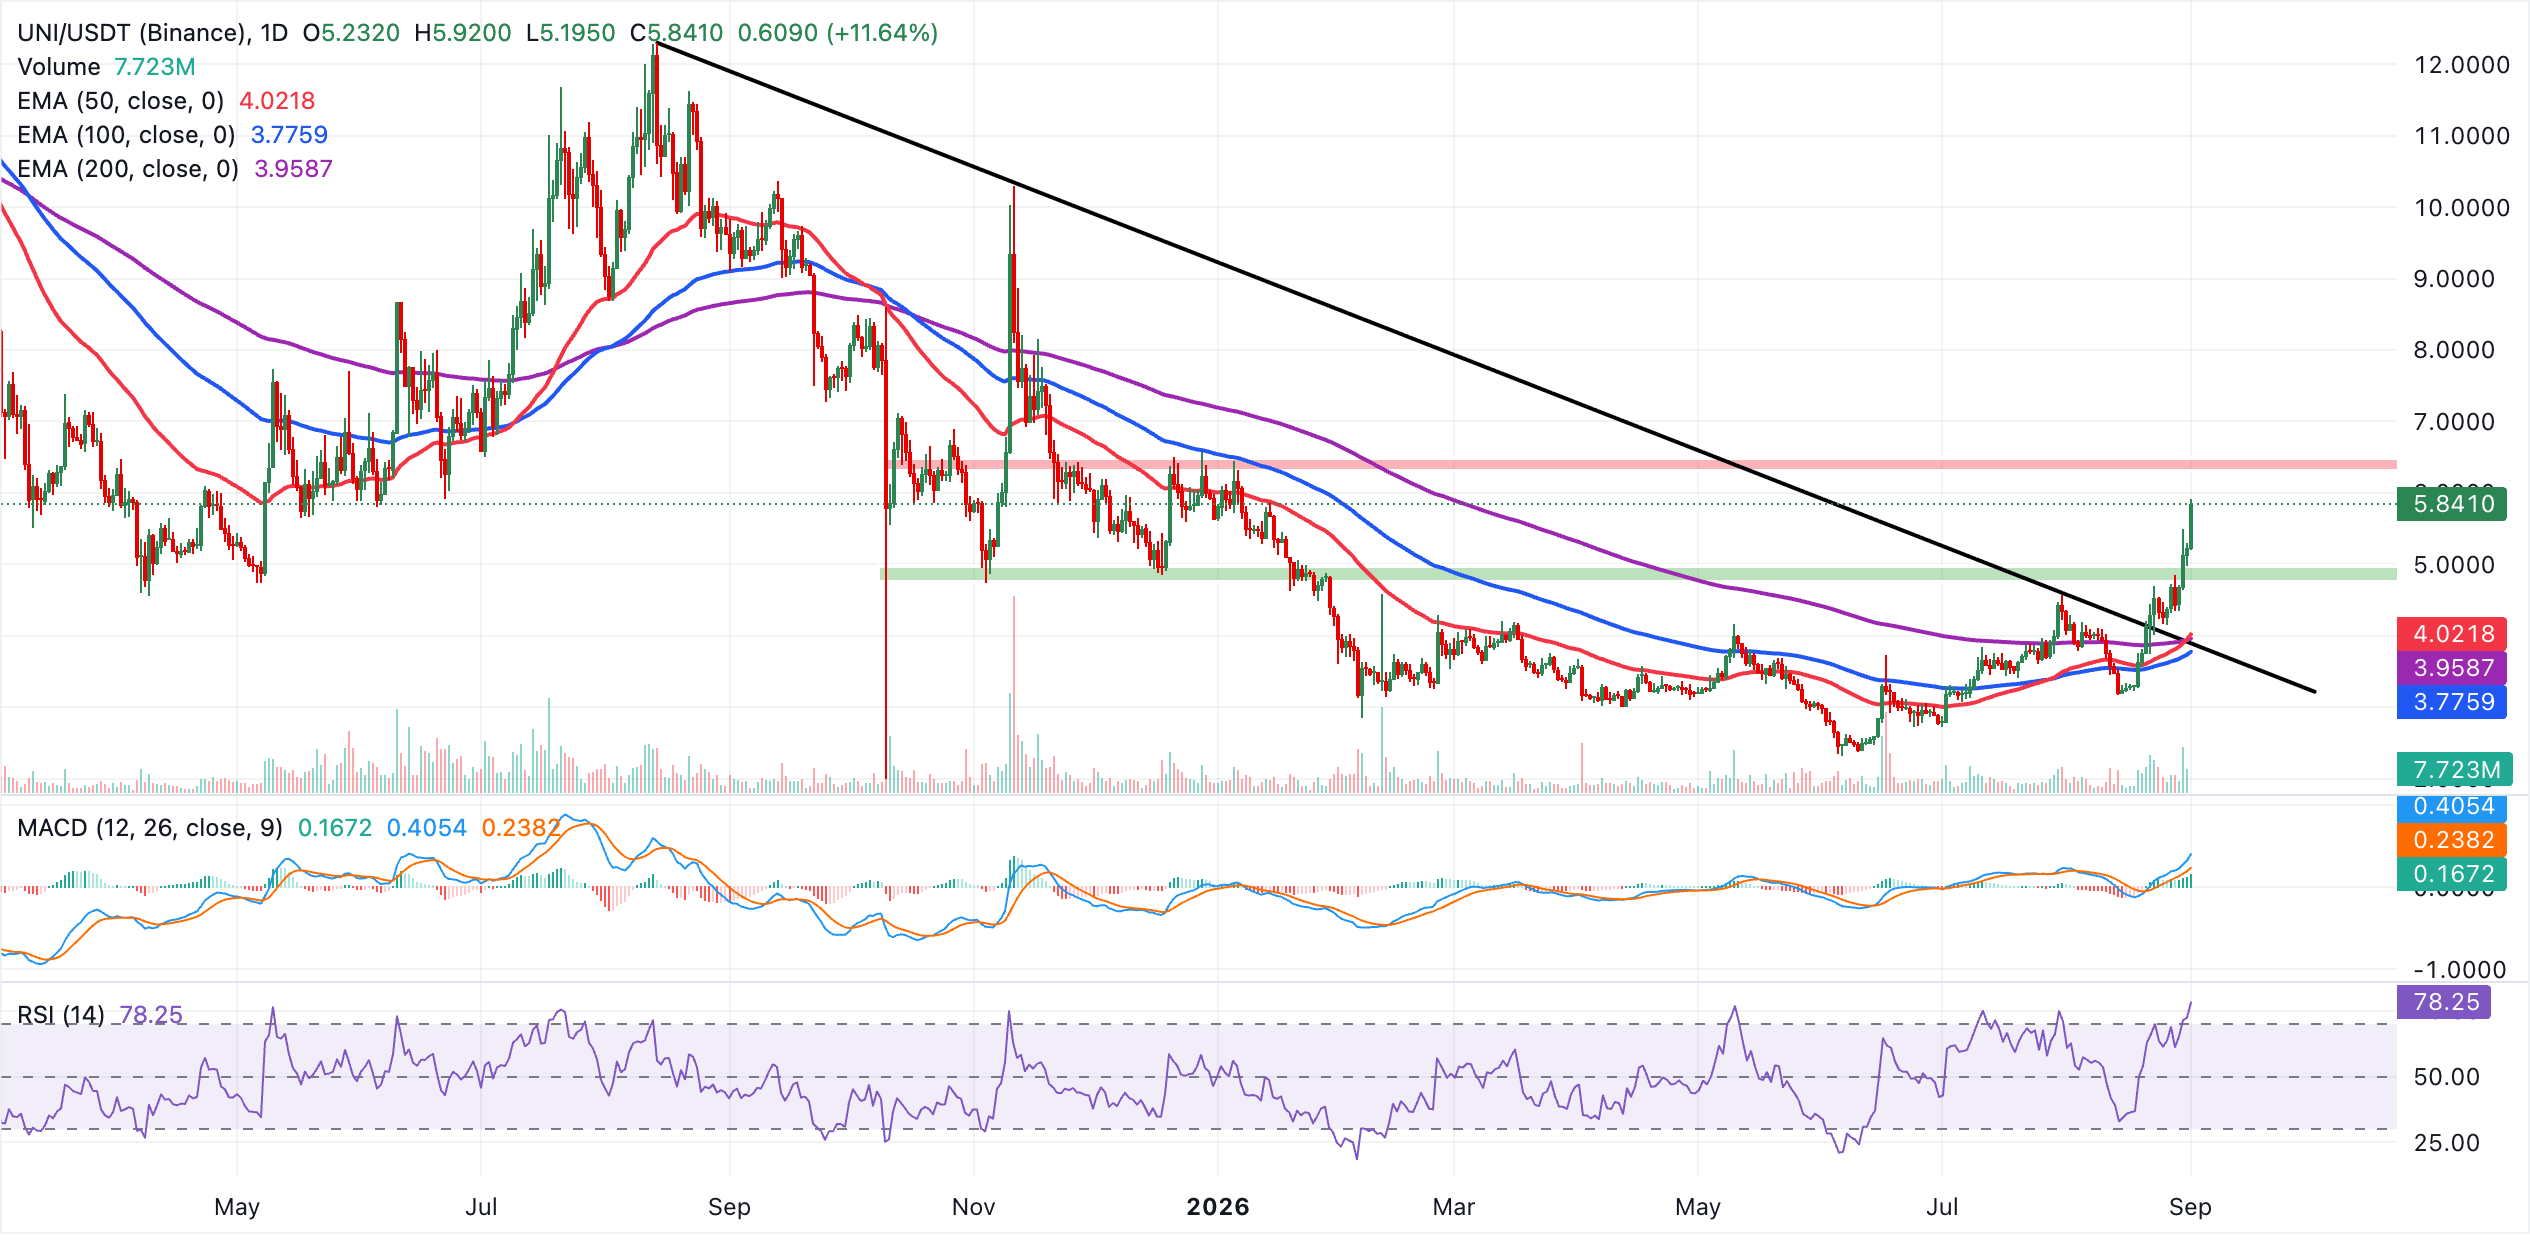
Initial support lies at the recent breakout zone defined by the 50-day EMA around $4.02, followed by the 200-day EMA at roughly $3.96 and the descending resistance trendline break near $3.89, with the 100-day EMA further down at about $3.78. While the current daily chart shows no clear overhead resistance, the overbought RSI suggests UNI could consolidate or correct before attempting a fresh leg higher, with pullbacks expected to find buyers as it approaches the clustered EMA support band.
(The technical analysis of this story was written with the help of an AI tool. Know more.)
Open Interest, funding rate FAQs
Higher Open Interest is associated with higher liquidity and new capital inflow to the market. This is considered the equivalent of increase in efficiency and the ongoing trend continues. When Open Interest decreases, it is considered a sign of liquidation in the market, investors are leaving and the overall demand for an asset is on a decline, fueling a bearish sentiment among investors.
Funding fees bridge the difference between spot prices and prices of futures contracts of an asset by increasing liquidation risks faced by traders. A consistently high and positive funding rate implies there is a bullish sentiment among market participants and there is an expectation of a price hike. A consistently negative funding rate for an asset implies a bearish sentiment, indicating that traders expect the cryptocurrency’s price to fall and a bearish trend reversal is likely to occur.
Author

John Isige
FXStreet
John Isige is a seasoned cryptocurrency journalist and markets analyst committed to delivering high-quality, actionable insights tailored to traders, investors, and crypto enthusiasts. He enjoys deep dives into emerging Web3 tren