Solana Price Forecast: SOL eyes $100 breakout amid governance voting, renewed ETF inflows
- Solana edges lower on Monday, holding above $90 after a 27% rise the previous week.
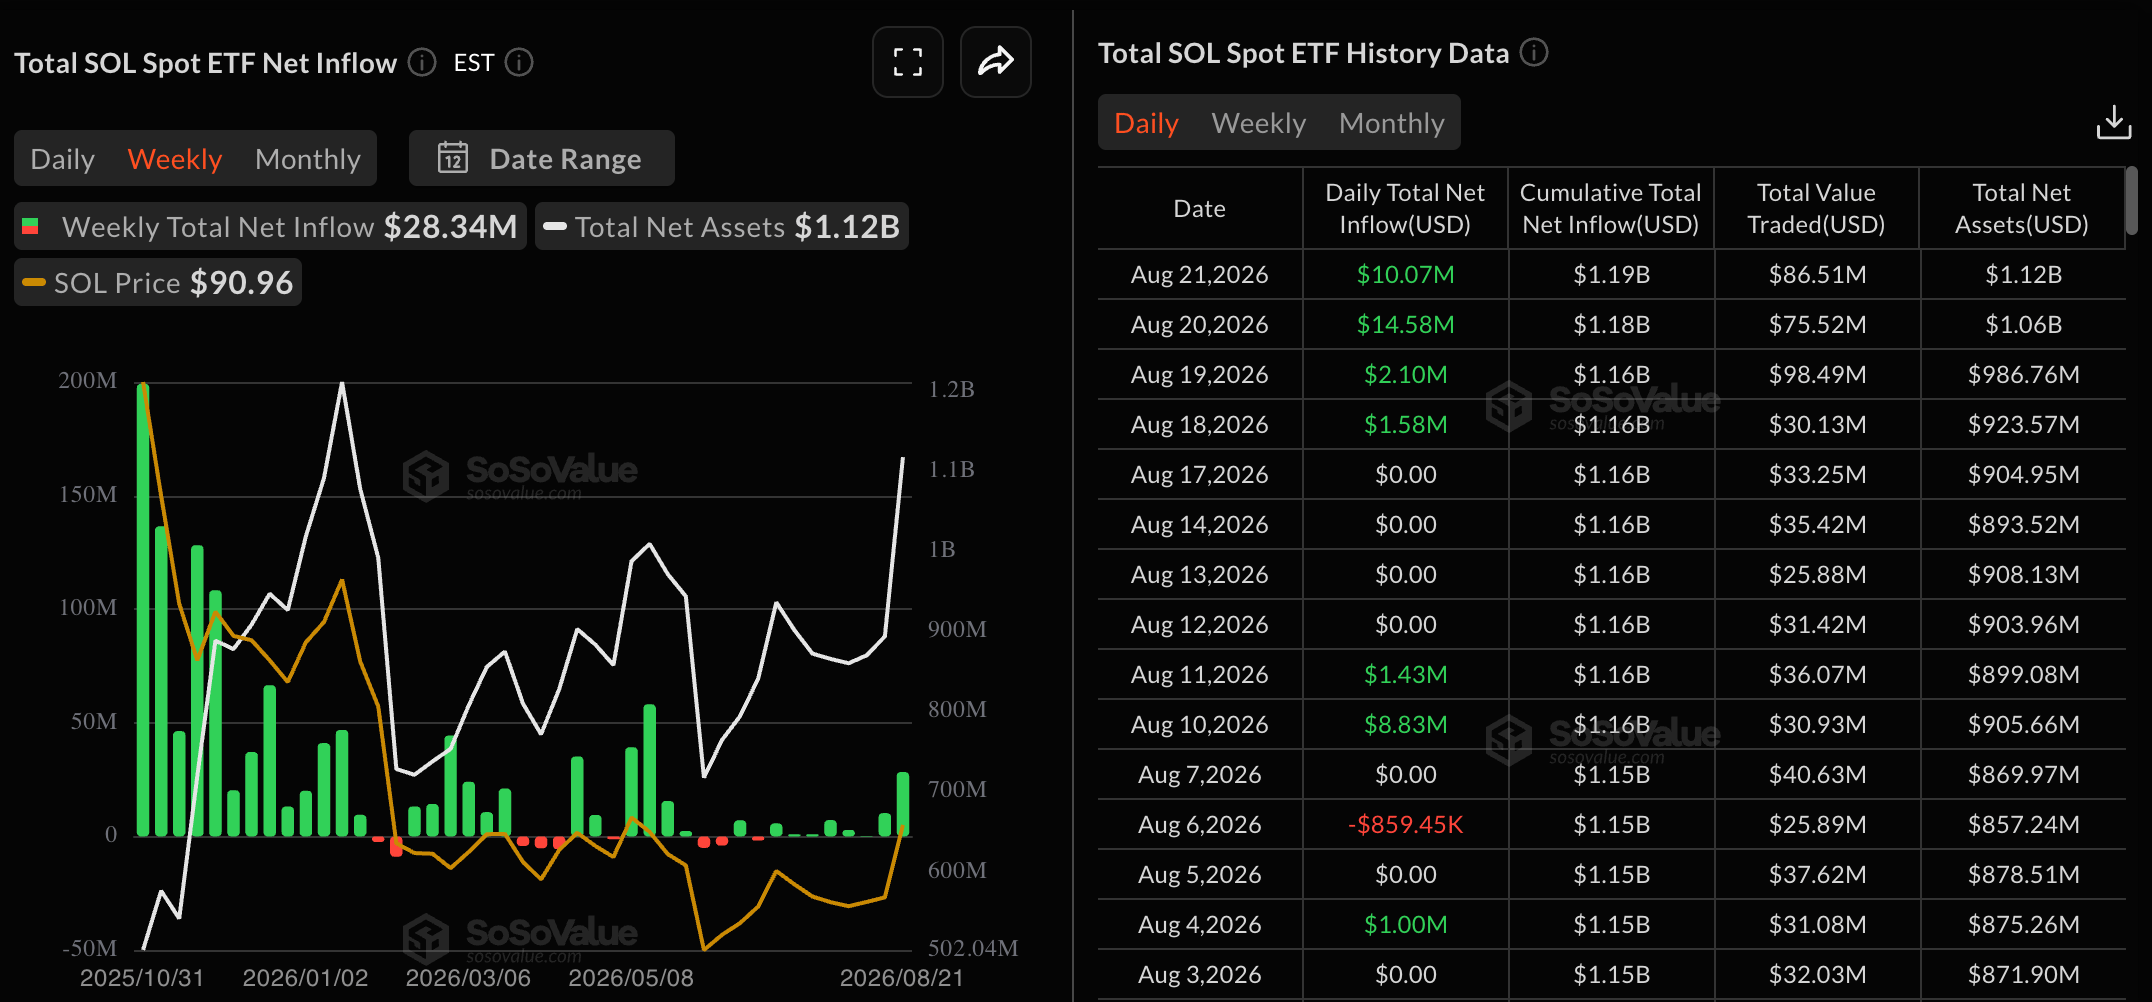
- SOL-focused ETFs recorded $28.34 million in inflows last week, the highest since mid-May, indicating renewed institutional demand.
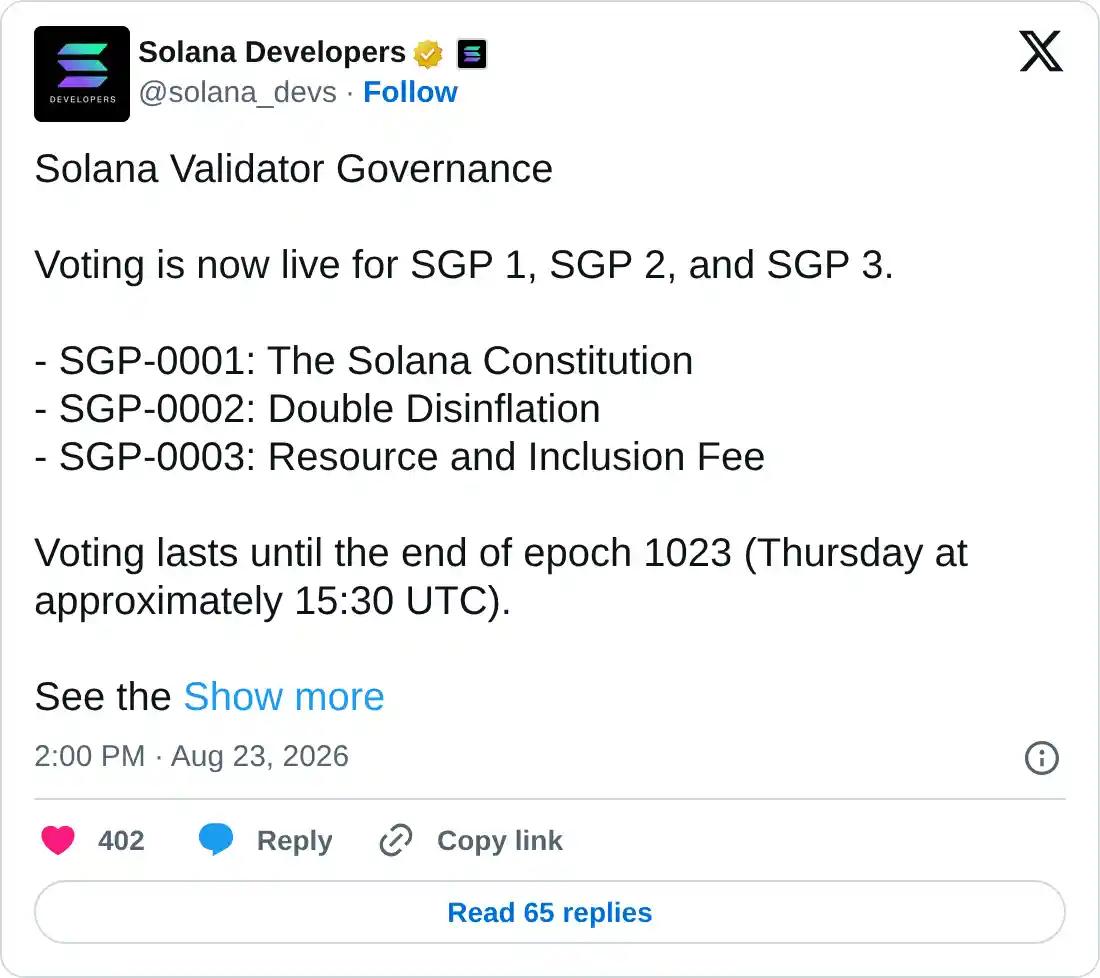
- Solana validator governance has started voting on SGP 1, SGP 2, and SGP 3, which include doubling the disinflation rate to -30%.

Solana (SOL) edges lower to $94 on Monday, following a 27% rebound last week to a two-month high. SOL-focused Exchange Traded Funds (ETFs) recorded four consecutive days of inflows last week, totaling $28.34 million, suggesting renewed institutional buying. Validator voting on multiple proposals started on Monday, which includes doubling the disinflation rate to 30%.
Solana validator voting begins
Solana validators have begun voting on SGP 1, SGP 2, and SGP 3 proposals, with voting ending Thursday. The SGP 1 protocol addresses the ratification of the Solana Constitution to govern Solana’s network-level decision-making. SGP 2 proposes reducing the inflation rate by increasing the disinflation rate to -15% to -30%. Finally, SGP 3 plans to introduce a fixed base inclusion fee paid to the block leader and a resource fee with a requested transaction cost, which will be burned.
Taken together, the proposals will restructure on-chain decision-making and reduce pressure on available supply.
Solana ETFs regain strength
Solana regains institutional demand. SoSoValue data shows the SOL-focused ETFs recorded $28.34 million in inflows last week, the highest over the last two months. Typically, renewed buying from institutional investors implies a bullish trend reversal.
Technical outlook: Will SOL price cross above $100?
Solana trades around $94 on Monday, holding a bullish near-term bias above both the 50-day Exponential Moving Average (EMA) at $79.04 and the 200-day EMA at $92.67. SOL price remains capped below the $100 psychological level and the May 11 high of $98.41.
For a sustained recovery, SOL should confirm a decisive close above the $100 mark. This could open the path toward the 127.2% Fibonacci extension level of the $98.41 to $60.13 downswing at $112.52.
Momentum stays strong, with the Relative Strength Index (RSI) hovering in overbought territory near 79 on the daily chart. At the same time, the Moving Average Convergence Divergence (MACD) shows a steady upward trend with a positive histogram, suggesting that buying pressure remains dominant.
On the downside, initial support is seen at the 200-day EMA around $92.67, followed by the 78.6% retracement near $88.56. Deeper declines would expose the 50-day EMA at $79.04 and the 50% retracement at $76.92.
(The technical analysis of this story was written with the help of an AI tool. Know more.)
Author

Vishal Dixit
FXStreet
Vishal Dixit holds a B.Sc. in Chemistry from Wilson College but found his true calling in the world of crypto.



