Pump.fun Price Forecast: PUMP rebounds amid growing Open Interest
- Pump.fun surges by more than 13% on Thursday to trade above $0.0015.
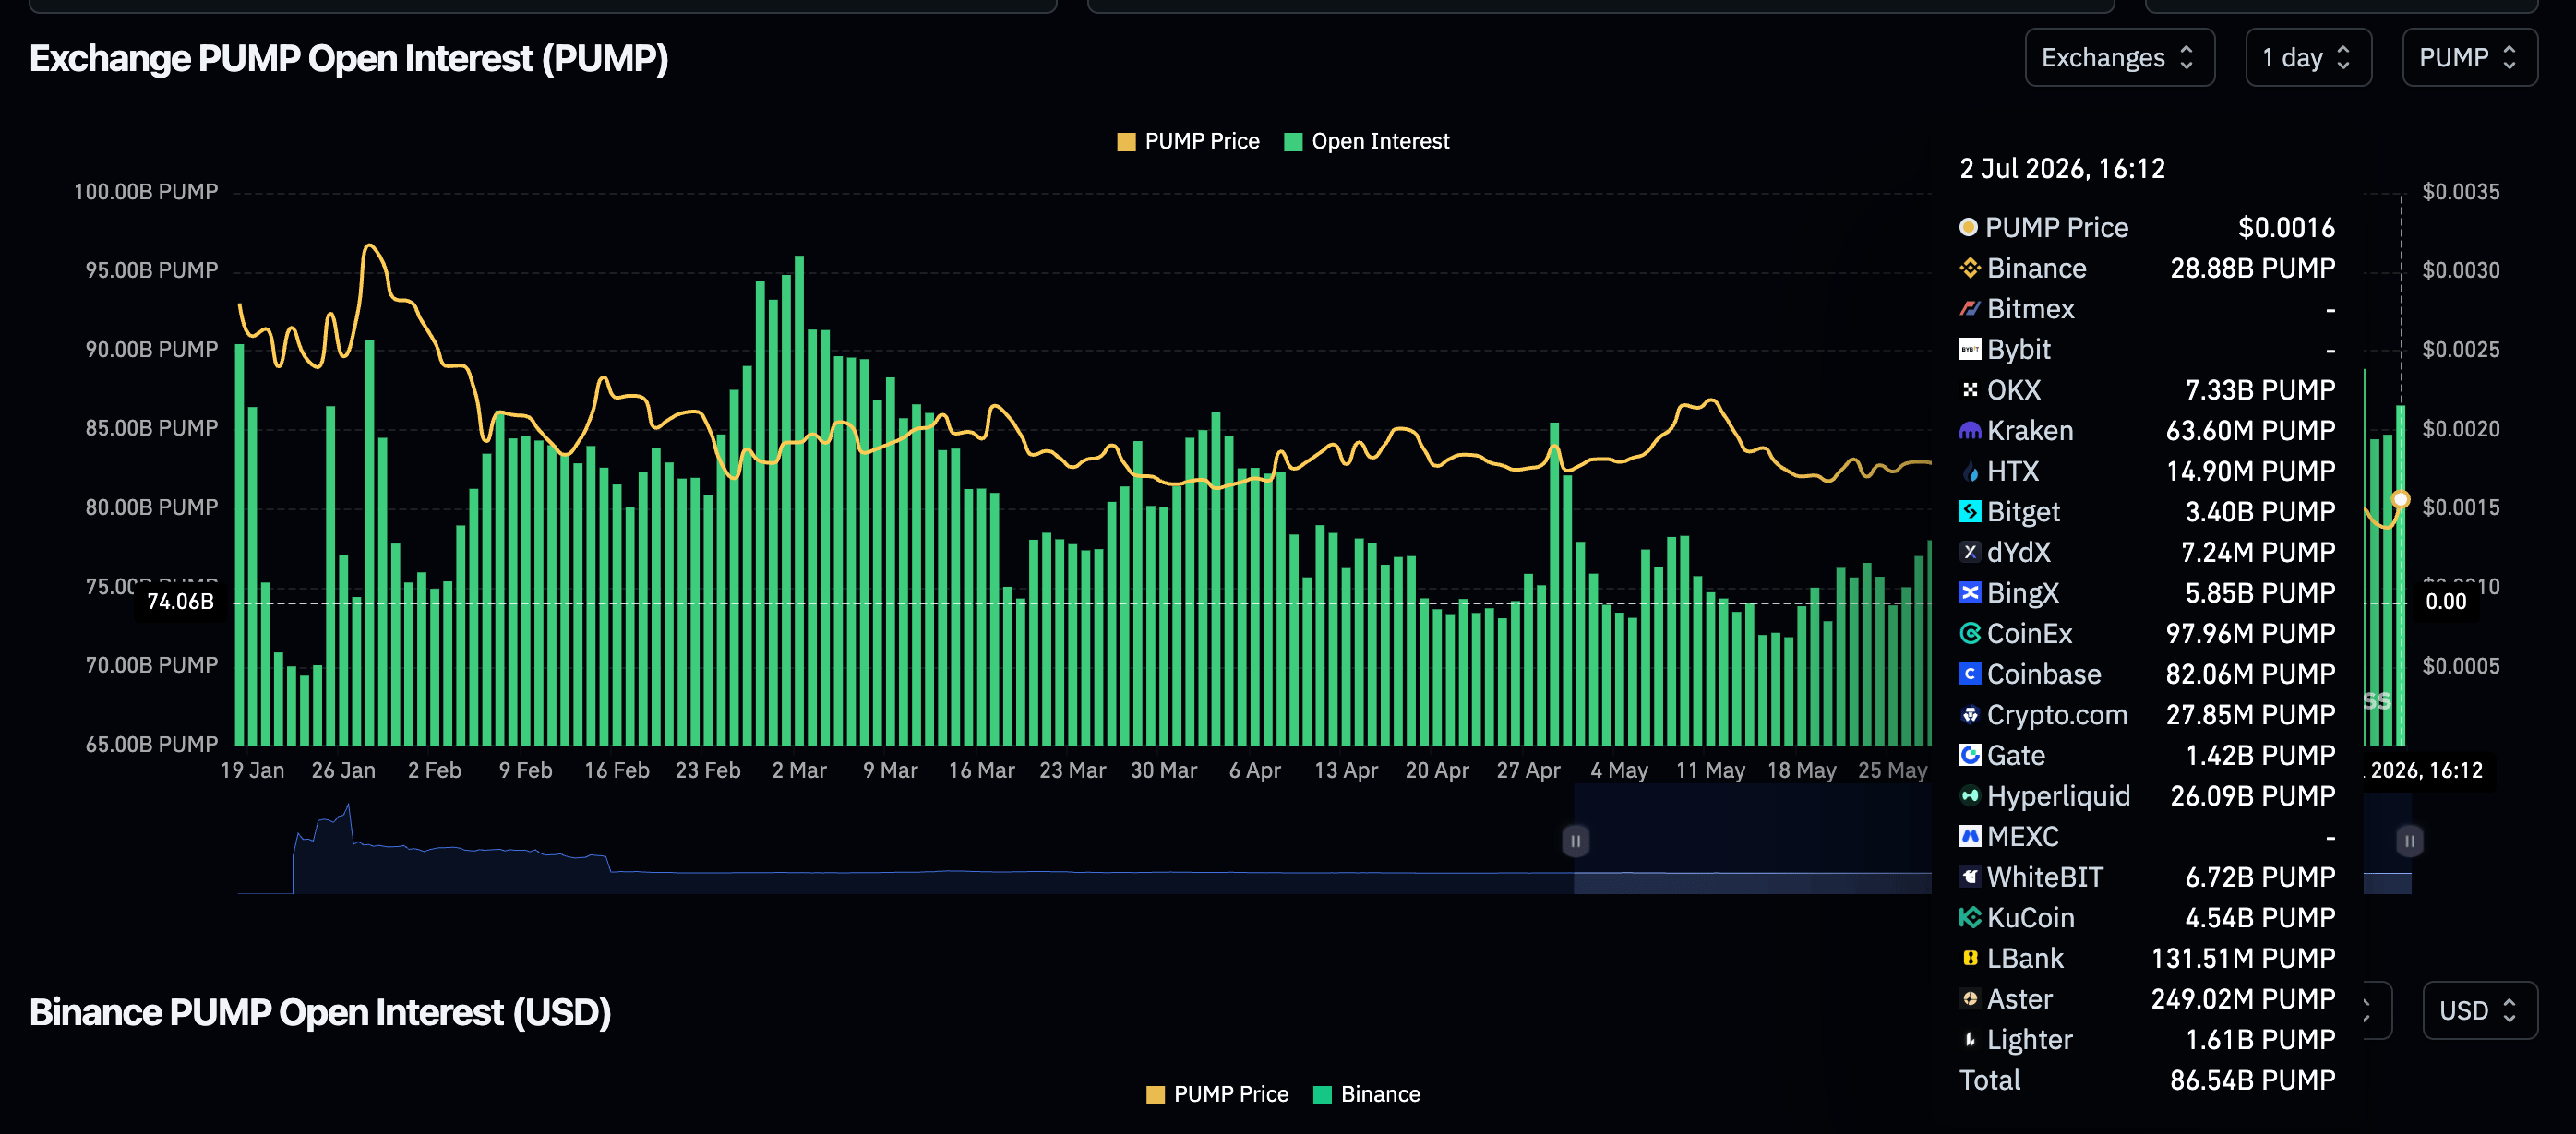
- The derivatives market remains relatively elevated, with Open Interest in perpetual futures rising to 86.54 billion PUMP.
- PUMP’s momentum is supported by an improving technical structure and a MACD buy signal.

Pump.fun (PUMP) edges higher on Thursday, building on support around $0.0014. The token trades above $0.0015, up by more than 13% on the day, backed by robust momentum indicators and a broadly recovering crypto market following weeks of heavy selling pressure.
PUMP derivatives activity climbs as risk appetite improves
Retail participation in the derivatives market remains relatively elevated, given that futures Open Interest (OI) averages 86.54 billion PUMP on Thursday, up from 84.68 billion PUMP the previous day. A broader scope suggests a stronger derivatives market at current levels than on June 24, when OI averaged 68.28 billion PUMP. If the growth is sustained, the increase in demand would support a short to medium-term recovery.
Price analysis: PUMP bulls test rebound strength
PUMP holds elevated above $0.0015 after breaking a two-day bearish streak, with support around $0.0014 encouraging buyers to reengage and increase risk exposure. Despite the price increase, the token retains a mildly bearish near-term bias, with upside capped by descending trendline resistance around $0.0017, which converges with the 100-day Exponential Moving Average (EMA).
The Relative Strength Index (RSI) at about 55 on the daily chart hints at improving but still moderate bullish momentum. Moreover, the Moving Average Convergence Divergence (MACD) histogram retains a bullish outlook on the same chart, suggesting recovery attempts are supported by PUMP's technical structure.
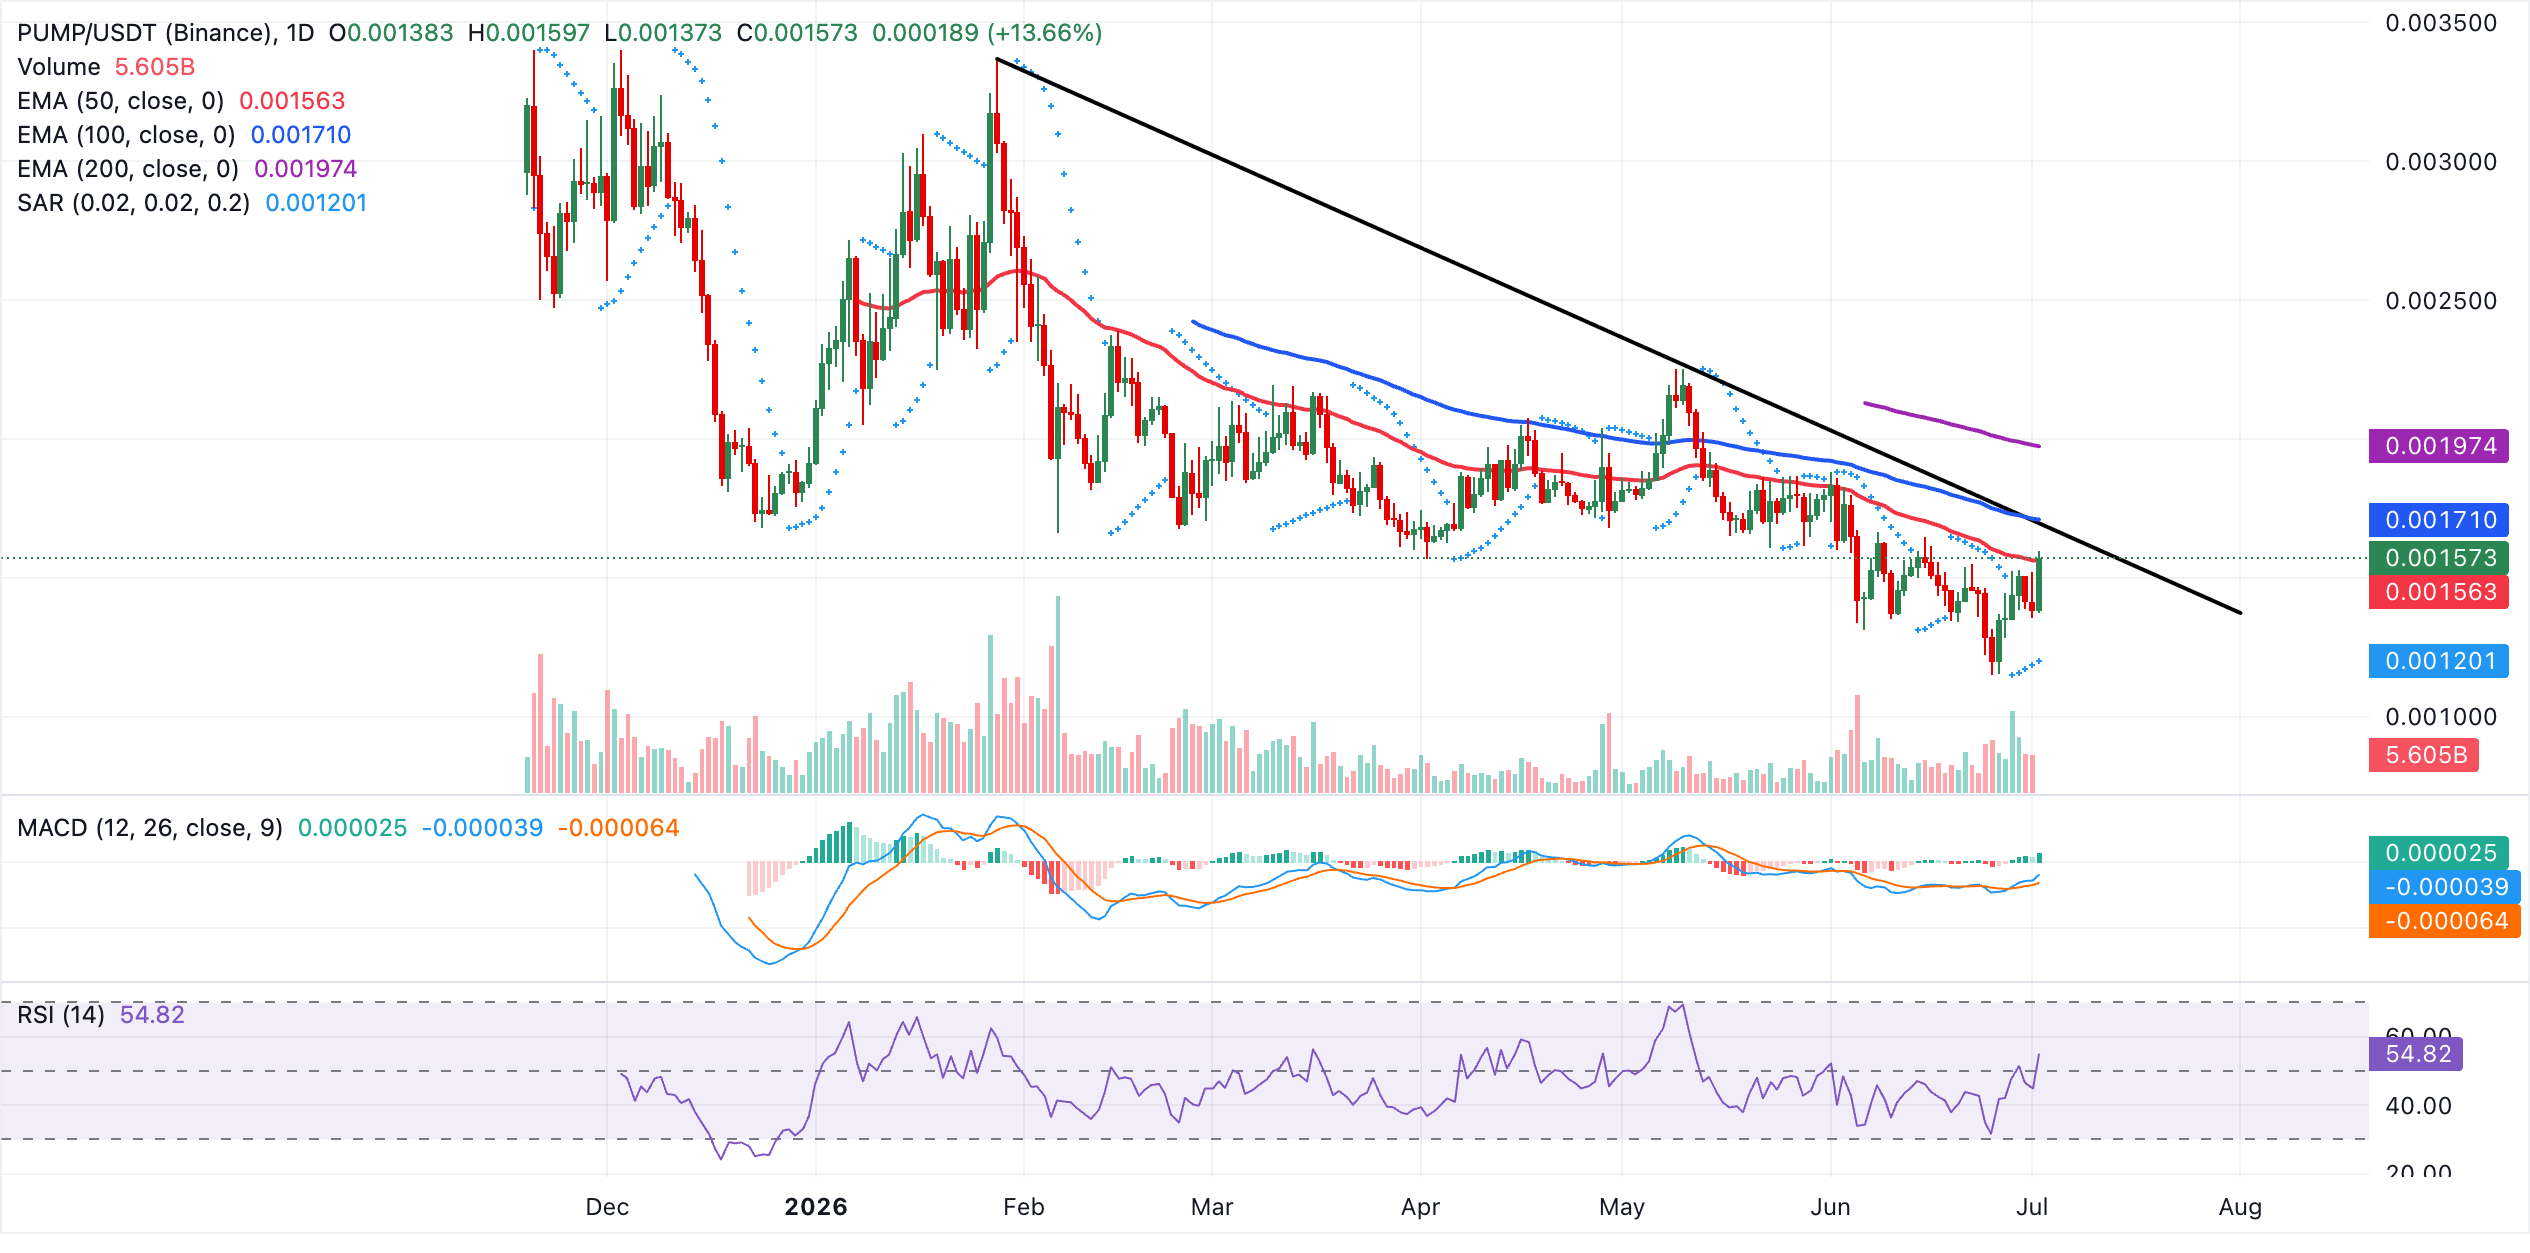
On the topside, initial resistance is clustered near $0.0017, where the descending trendline and the 100-day EMA converge, before a stronger barrier emerges at the 200-day EMA around $0.0020. Looking down, the Parabolic SAR at $0.0012 offers the next meaningful support level, with a daily close below that signal likely opening the door to a deeper pullback in the short term.
(The technical analysis of this story was written with the help of an AI tool.)
Open Interest, funding rate FAQs
Higher Open Interest is associated with higher liquidity and new capital inflow to the market. This is considered the equivalent of increase in efficiency and the ongoing trend continues. When Open Interest decreases, it is considered a sign of liquidation in the market, investors are leaving and the overall demand for an asset is on a decline, fueling a bearish sentiment among investors.
Funding fees bridge the difference between spot prices and prices of futures contracts of an asset by increasing liquidation risks faced by traders. A consistently high and positive funding rate implies there is a bullish sentiment among market participants and there is an expectation of a price hike. A consistently negative funding rate for an asset implies a bearish sentiment, indicating that traders expect the cryptocurrency’s price to fall and a bearish trend reversal is likely to occur.
Author

John Isige
FXStreet
John Isige is a seasoned cryptocurrency journalist and markets analyst committed to delivering high-quality, actionable insights tailored to traders, investors, and crypto enthusiasts. He enjoys deep dives into emerging Web3 tren



