Polkadot dives below key support as DOT eyes $35
- Polkadot price moves below a fundamental Ichimoku support level for the first time since September 30th.
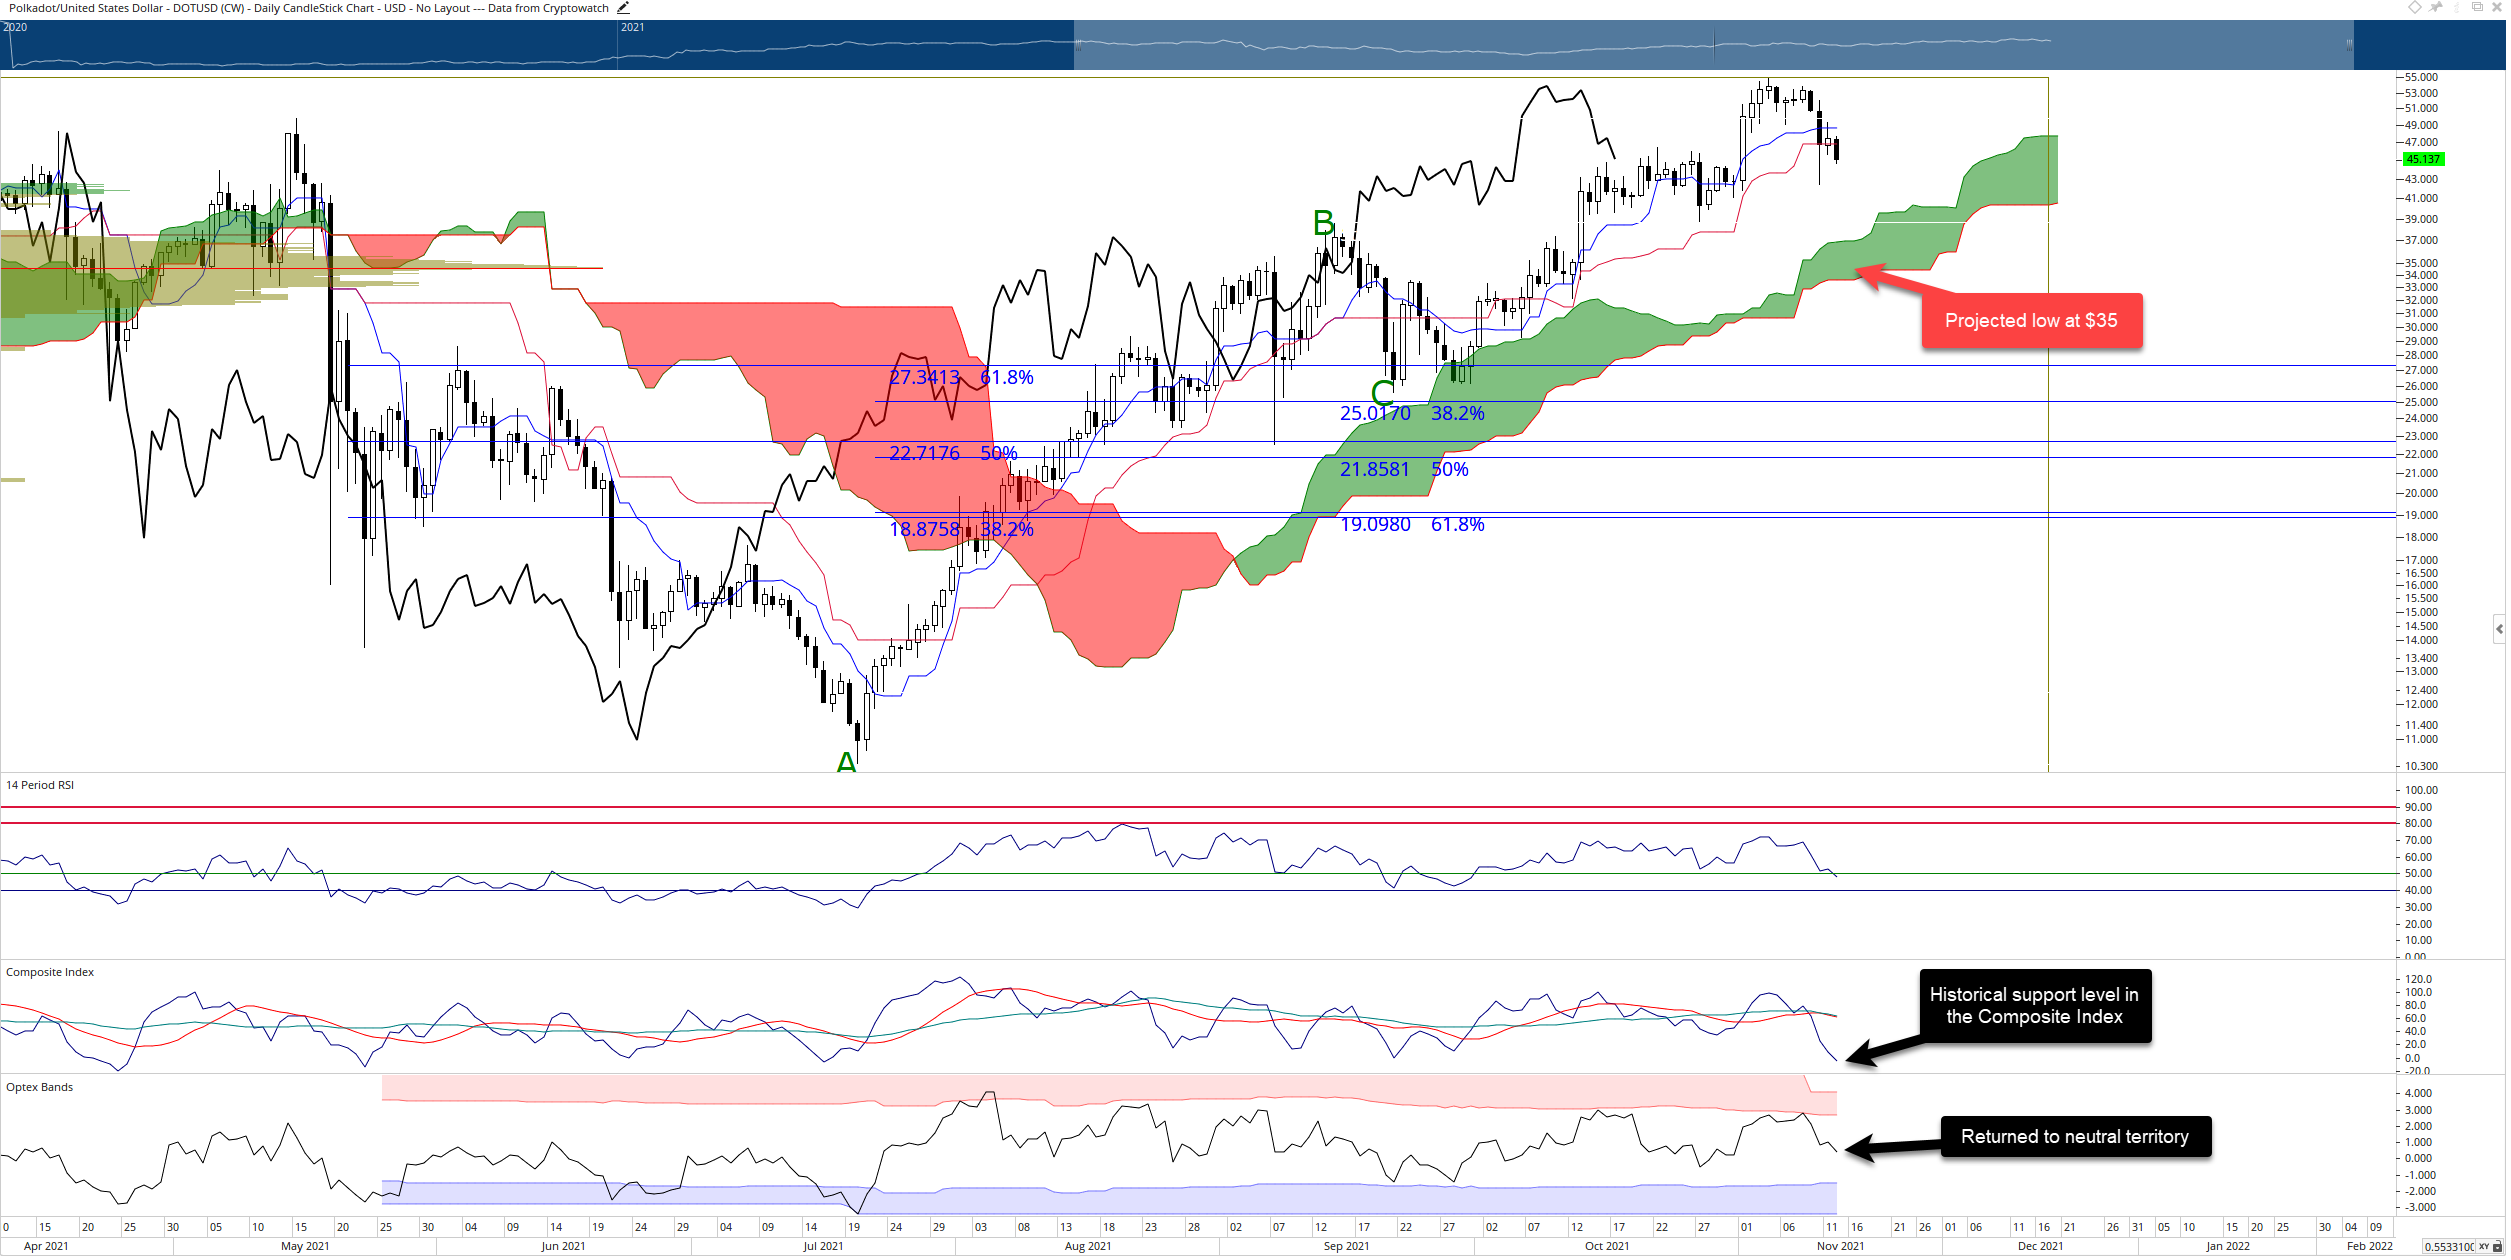
- 27% drop ahead for Polkadot as little support structure exists between the Friday open and the projected low.
- A pullback in Polkadot is necessary to maintain a healthy and growing market.

Polkadot price has moved below the daily Kijun-Sen for the first time since September 30th. This could trigger some increased selling pressure that extends through the weekend.
Polkadot price target for a down move is limited to $35
Polkadot price has a substantial gap between support levels on the daily Ichimoku chart. The near-term support levels of the Tenken-Sen ($48.75) and the Kijun-Sen ($46.88) have failed to act as support. Below those two Ichimoku levels, no more Ichimoku support exists, only a high volume node at $41. But if that fails, then traders should expect a swift move lower.
The 2021 volume profile is extremely thin below $41, which could act as an accelerant to push Polkadot price lower towards $37. However, buyers may be waiting around the $37 level to re-enter because it contains the final Ichimoku support level, Senkou Span B, and the 2021 Volume Point Of Control. The combination of those two levels provides an overwhelmingly supportive price zone.
However, the anticipated bearish sell-off may not play out. The oscillators show that some pullback levels have been reached and that downside pressure may not be as low as projected. The Relative Strength Index is testing the oversold levels of 50 and 40 – which have held firm over the three and half months. Additionally, the Optex Bands have moved out of overbought extremes and entered into neutral territory. Finally – and most importantly – the Composite Index has reached its historical support level and has created hidden bullish divergence.
DOT/USDT Daily Ichimoku Chart
A daily close of Polkadot price above $53 would invalidate any near-term bearish sentiment.
Author

Jonathan Morgan
Independent Analyst
Jonathan has been working as an Independent future, forex, and cryptocurrency trader and analyst for 8 years. He also has been writing for the past 5 years.


