• Polkadot price moves sideways after hitting the $55 value area.
  • The market appears to be coming to Polkadot to correct instead of Polkadot moving lower.
  • Downside movement may be more limited than its peers.

Polkadot price shows that it may not experience a steep retracement if there is a pullback in the cryptocurrency market. A pullback is still likely, but the move would be within the recently traded price action range. Therefore, Polkadot may be positioning for a breakout earlier than the rest of the market, continuing its behavior as a cryptocurrency market leader.

Polkadot price congestion could be an early sign of future bullish momentum

Polkadot price has an uncommon kind of behavior to it. It recently had sizable gaps between the close and the Tenkan-Sen, indicating that strong near-term pullbacks were likely to occur. Instead, Polkadot has traded sideways, and the least expected reaction to Tenkan-Sen and price gaps has occurred: the Tenkan-Sen rose to equilibrium with Polkadot. This means that less time is needed and that Polkadot should expect less volatility to begin its next swing higher.

How long will traders need to wait until Polkadot price can continue its bull run? Perhaps not as long as one would think. The Relative Strength Index is in neutral territory, so it can sustain any bullish breakout. Likewise, the Composite Index is at a neutral level but crossing below both of its averages – that could warn of some selling pressure soon. Finally, the Optex Bands are at extremes and are just now moving lower from those extreme overbought conditions.

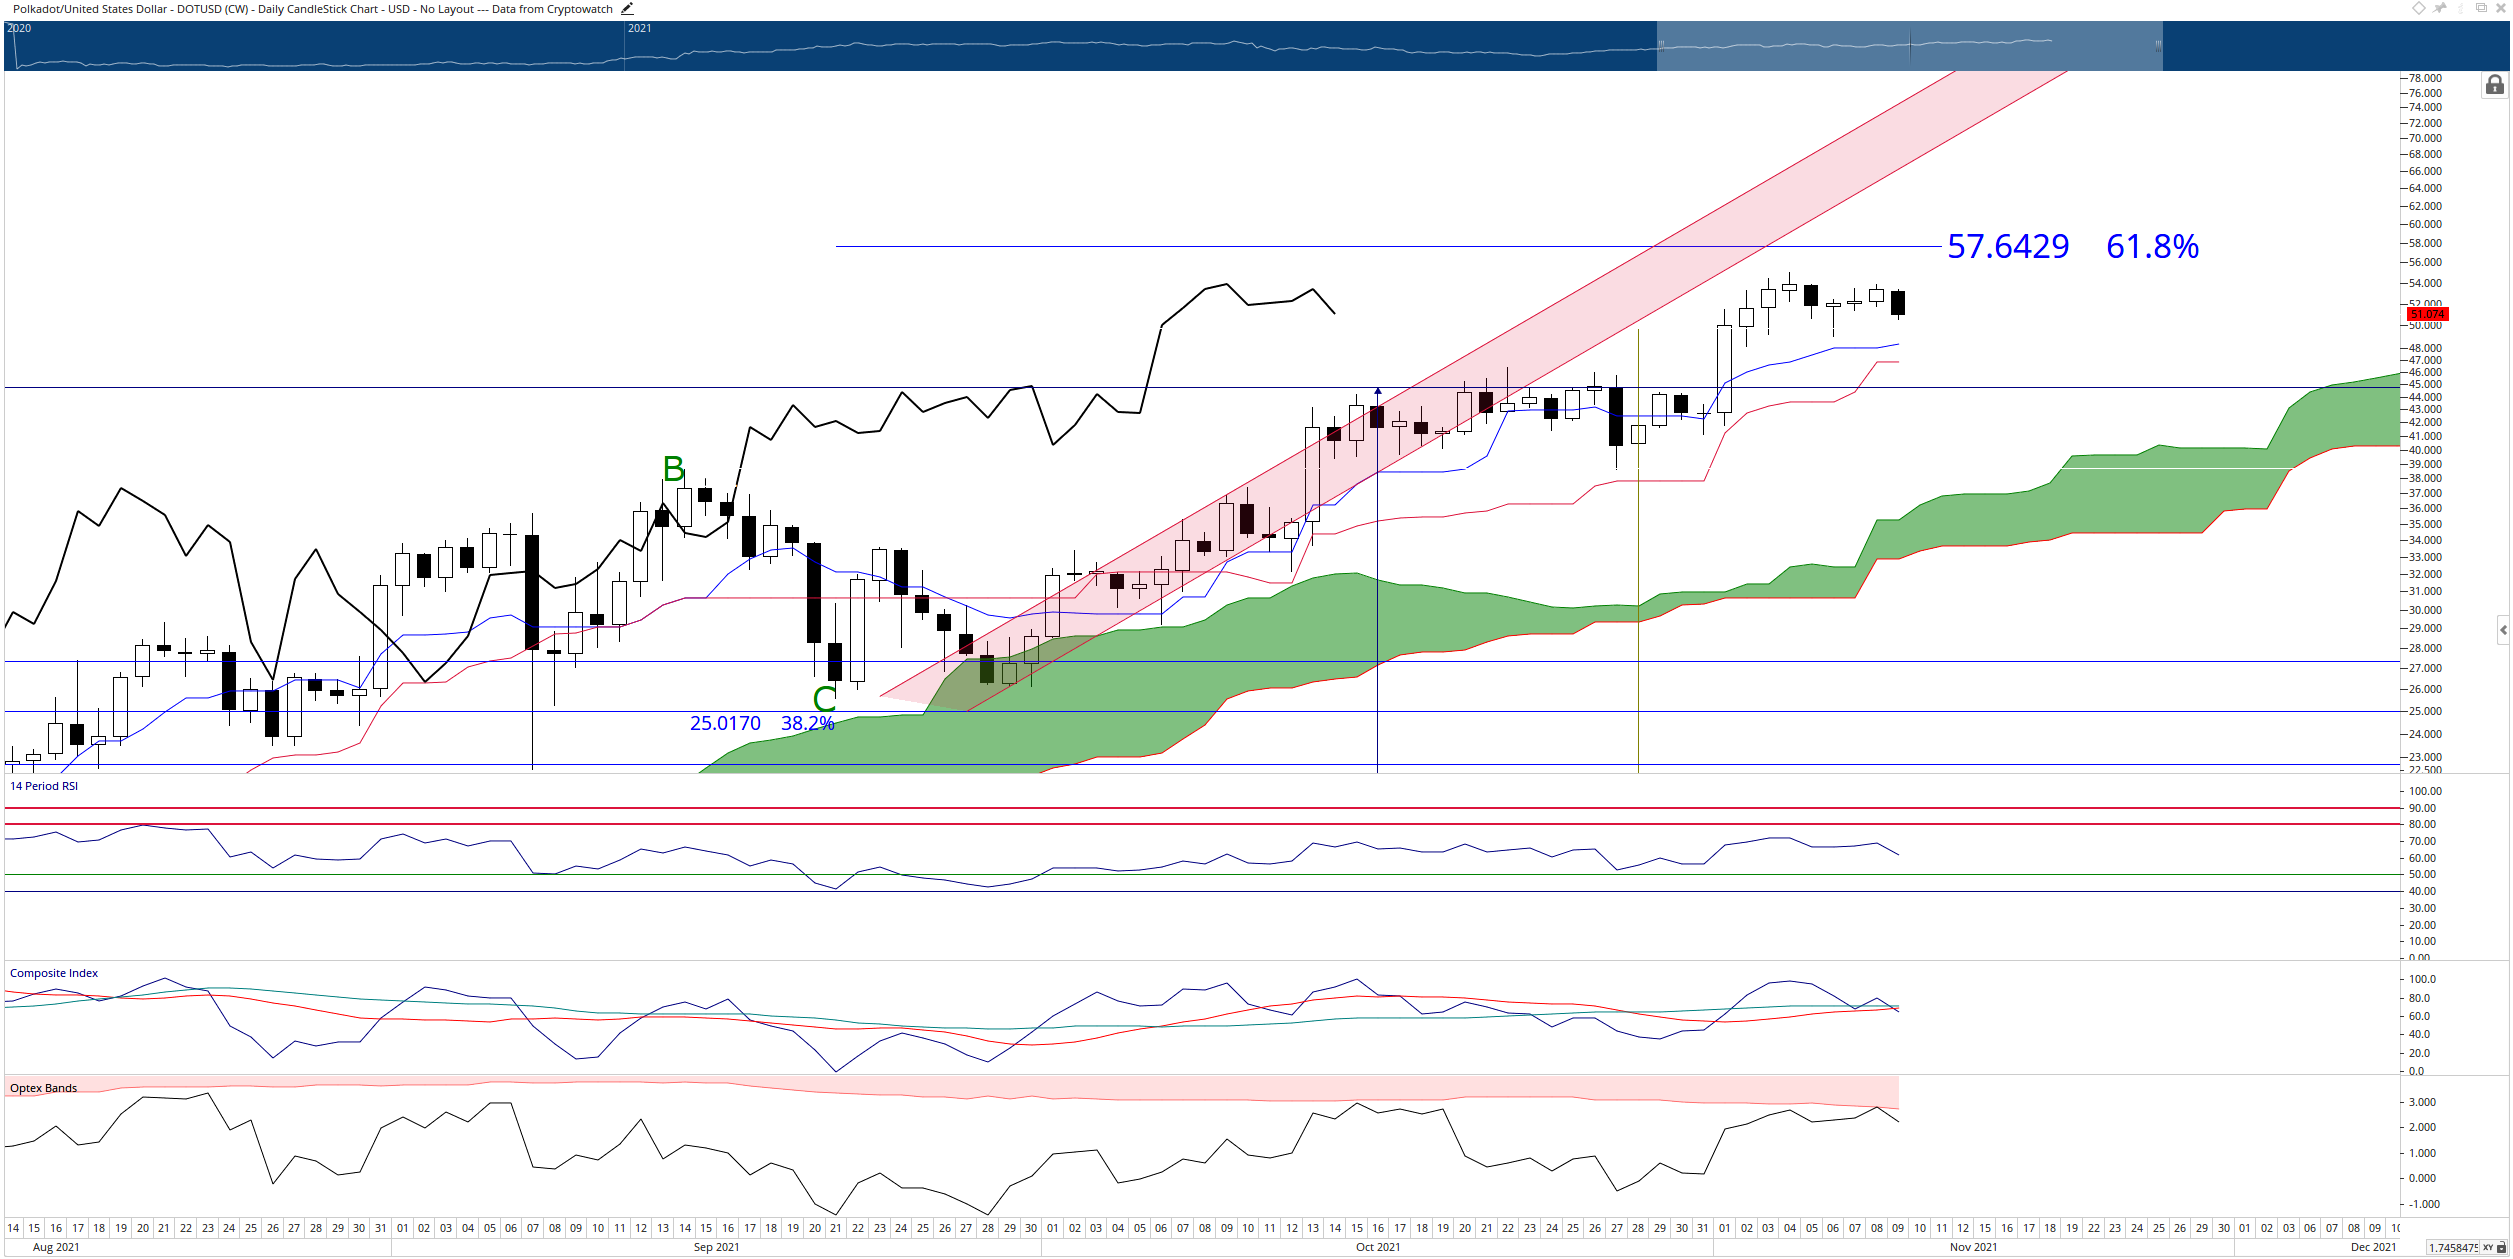
DOT/USD Daily Ichimoku Chart

Buyers may want to wait until there is a close above the 61.8% Fibonacci expansion at $57.64. Any move to that level over the next week would likely position Polkadot’s oscillators back into overbought conditions. In addition, hodlers will want to be careful of any drop below the Kijun-Sen at $46 over the next week. A close below the Kijun-Sen could trigger intense selling pressure, especially if that close occurs between today and Friday. Because the Optex Bands are just coming off extreme overbought levels and the Composite Index is crossing below its moving averages at a neutral level, any close at or below $46 could trigger a selloff.


Note: All information on this page is subject to change. The use of this website constitutes acceptance of our user agreement. Please read our privacy policy and legal disclaimer. Opinions expressed at FXstreet.com are those of the individual authors and do not necessarily represent the opinion of FXstreet.com or its management. Risk Disclosure: Trading foreign exchange on margin carries a high level of risk, and may not be suitable for all investors. The high degree of leverage can work against you as well as for you. Before deciding to invest in foreign exchange you should carefully consider your investment objectives, level of experience, and risk appetite. The possibility exists that you could sustain a loss of some or all of your initial investment and therefore you should not invest money that you cannot afford to lose. You should be aware of all the risks associated with foreign exchange trading, and seek advice from an independent financial advisor if you have any doubts.

Join Telegram

Recommended content


Recommended Content

Editors’ Picks

Ripple on-chain metrics show bullish signs amidst legal struggle with SEC, XRP eyes recovery

Ripple on-chain metrics show bullish signs amidst legal struggle with SEC, XRP eyes recovery

Ripple made a comeback above $0.48 on Tuesday and hovers above that level in Wednesday’s European session. Ripple on-chain metrics such as transaction volume and Network Realized Profit/Loss have turned bullish, supporting a recovery in the altcoin. 

More Ripple News

Bitcoin price falls amidst German government transfers, miners activity

Bitcoin price falls amidst German government transfers, miners activity

Bitcoin (BTC) extends correction on Wednesday and hovers around $61,000 after finding resistance near the $64,000 level on Monday. Recent on-chain data indicates heightened selling activity from Bitcoin miners early in the week. 

More Bitcoin News

Crypto Today: Bitcoin erases gains from end of June, Ethereum declines while Ripple holds

Crypto Today: Bitcoin erases gains from end of June, Ethereum declines while Ripple holds

Bitcoin wipes out gains from the last week of June and falls below $60,000 on Wednesday. Ethereum and top altcoins ranked by market capitalization erased gains as the inflation outlook worsened. Ripple holds on to recent gains and hovers above $0.48 on Wednesday. 

More Cryptocurrencies News

Three reasons why altcoins could shake off losses this week

Three reasons why altcoins could shake off losses this week

On-chain data from Santiment shows that altcoins are currently in the opportunity zone, or generating buy signals. The top three altcoins in the buy zone are Basic Attention Token (BAT), Chromia (CHR), and Highstreet (HIGH), per Santiment. 

More Altcoins News

Bitcoin: BTC price correction could end in July, according to seasonal data

Bitcoin: BTC price correction could end in July, according to seasonal data

Bitcoin (BTC) price appears poised for a decline this week, influenced by slight outflows in US spot ETFs, selling activity among BTC miners, and a combined transfer of 4,690.28 BTC to centralized exchanges by the US and German governments.

Read full analysis

BTC

ETH

XRP