Pi Network Price Forecast: PI eyes extended crash as crypto market dips
- Pi Network hit a record low on Monday, aligning with the community meetup in South Korea.
- CEXs' wallet reserves decline by nearly 8 million PI, indicating increased demand at lower prices.
- The technical outlook holds a bearish bias, hinting at further losses.

Pi Network (PI) edges lower by 5% at press time on Tuesday, advancing the 19% drop from the previous day. The sudden crash in Pi marks the failure of Pi Network founders to boost investor sentiment by visiting the Seoul community meetup on Monday. The technical outlook indicates further risk for PI as bearish momentum increases.
Still, the declining wallet reserve of Centralized Exchanges (CEXs) indicates that confident investors are buying the dip.
CEXs wallet reserve declines as PI rebounds from record low
Nicolas Kokkalis and Chengdiao Fan, founders of Pi Network, attended the community meetup in collaboration with Sign in Seoul on Monday. The founders shared a presentation on smart contract development on Pi Network, highlighting the upcoming protocol upgrade and AI-driven KYC features for faster user onboarding. However, the meetup failed to lift the investors' mood as the PI token reached a record low of $0.1842 on Monday, before closing the day at $0.2860.
Regardless of the recent crash, PiScan data shows a net outflow of 7.96 million PI tokens from CEXs' reserves over the last 24 hours, aligning with the rebound from the record low. This suggests that the confident investors are acquiring the mobile mining cryptocurrency at discounted prices.
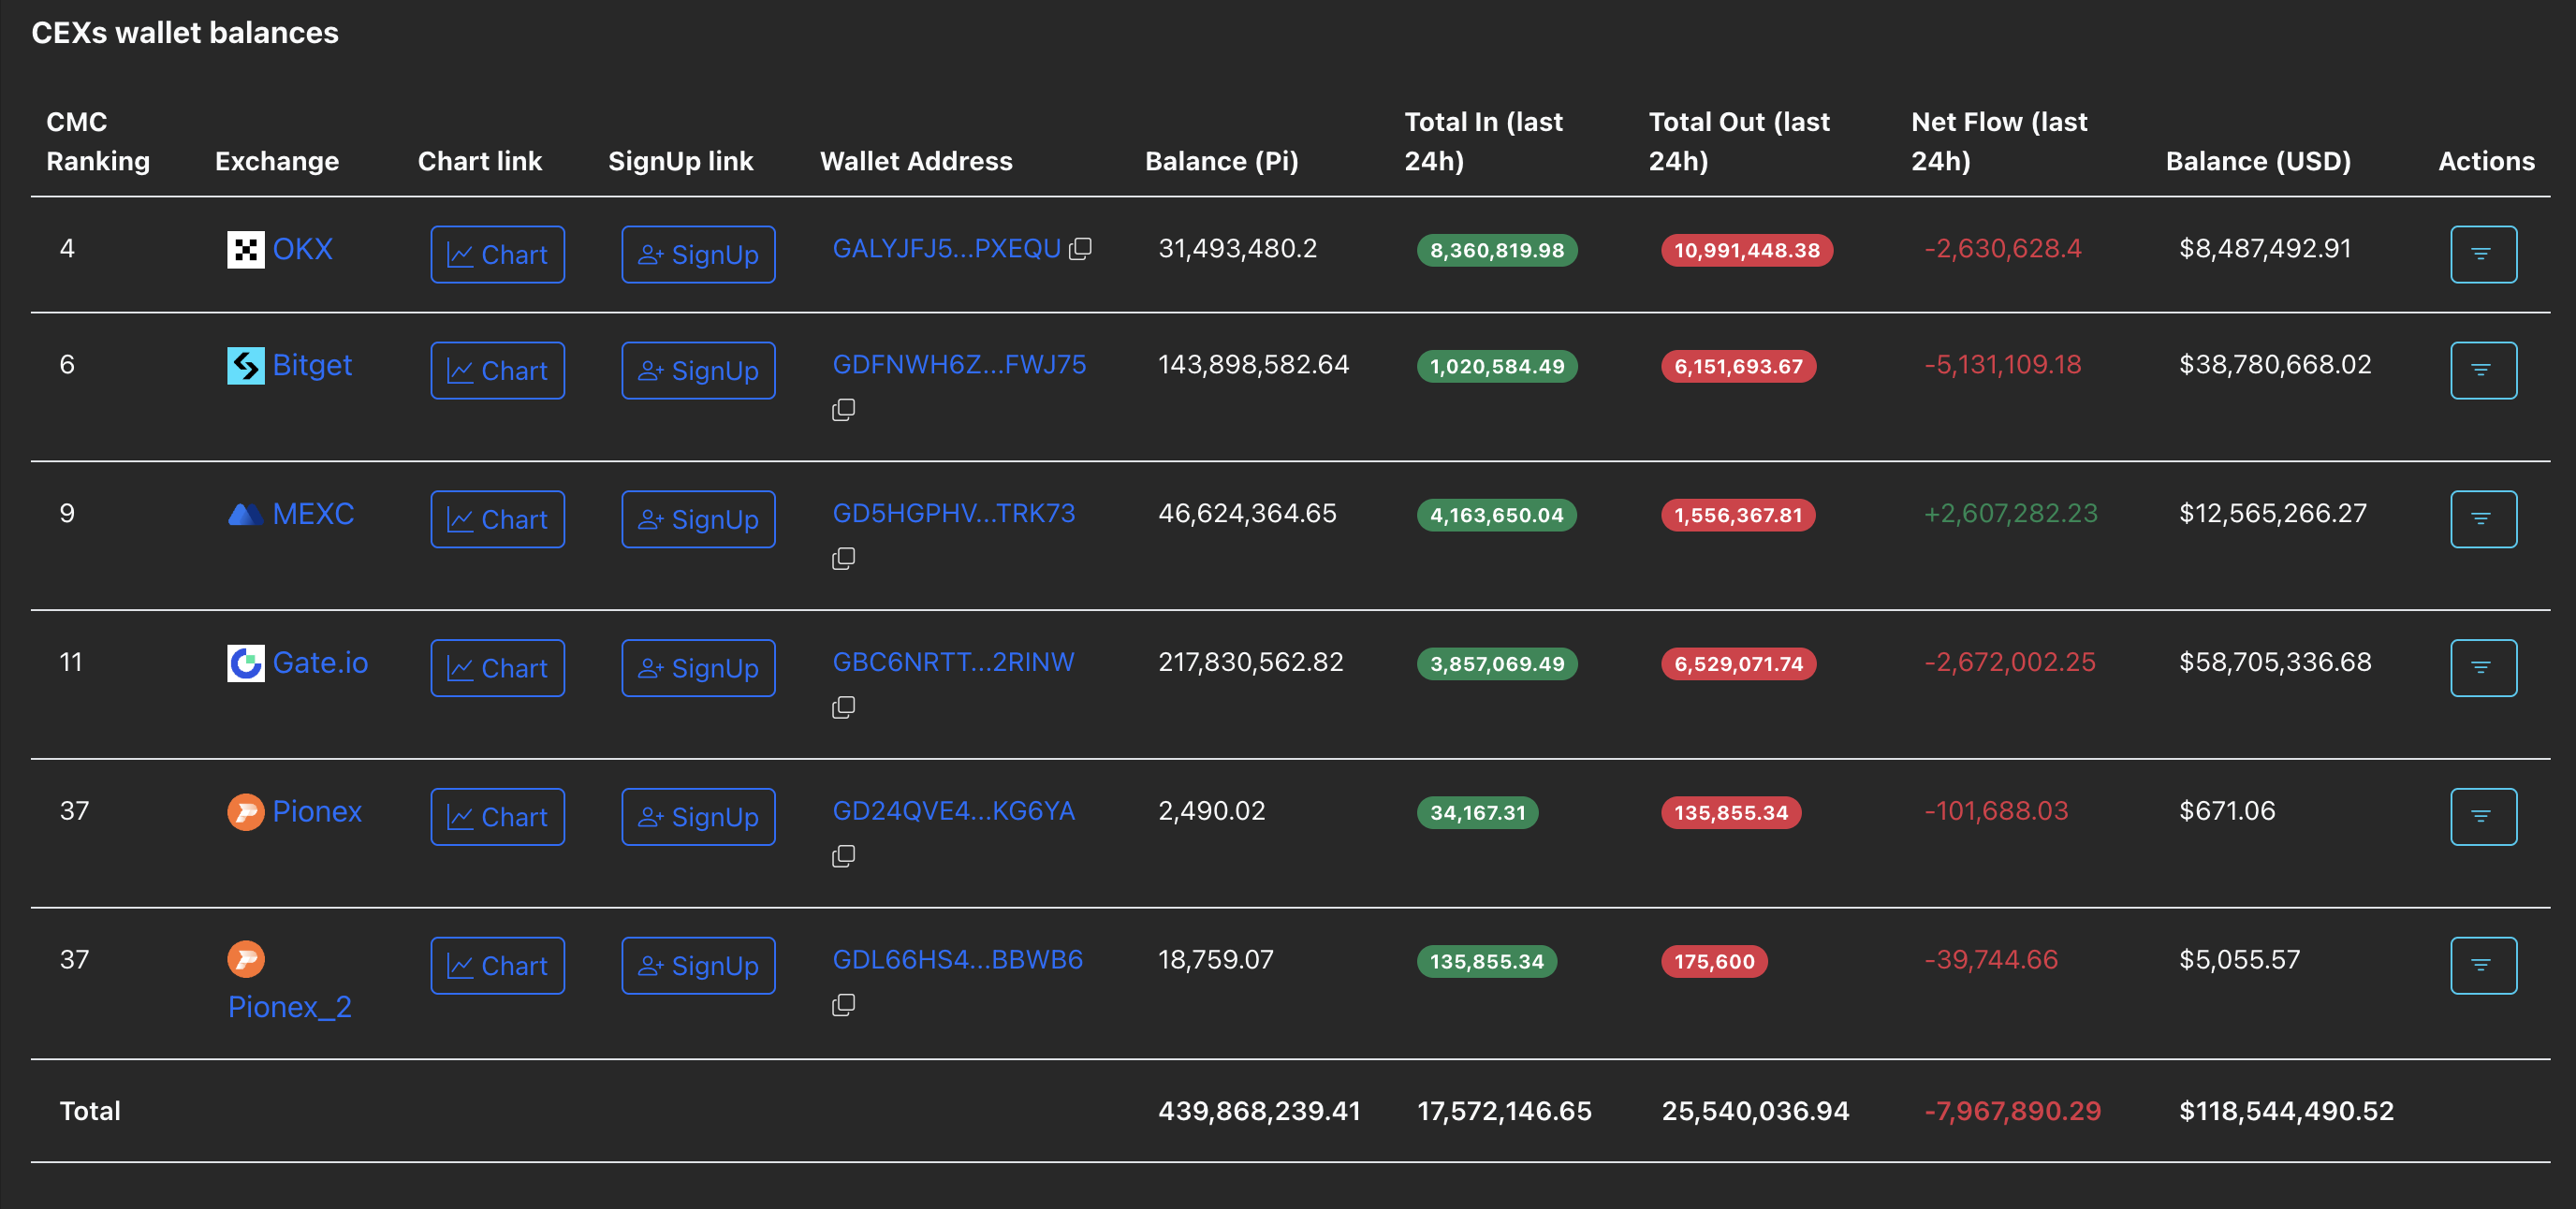
CEXs wallet balances. Source: PiScan.
Bearish momentum supplements Pi Network’s downside risk
Pi Network trades around $0.2700 at the time of writing on Tuesday, extending the loss for the third straight day. The pullback invalidates the falling channel breakout and targets the S2 pivot level at $0.2387.
A decisive close below the all-time low of $0.1842 would confirm the breakdown of the falling channel pattern. This could result in a further decline to the S3 pivot level at $0.1555.
The momentum indicators on the daily chart suggest a sell-side dominance as the Relative Strength Index (RSI) at 25 drops into the oversold zone. Furthermore, the Moving Average Convergence Divergence (MACD) extends the declining trend after crossing below its signal line on Sunday. This indicates that the bearish momentum is rising.
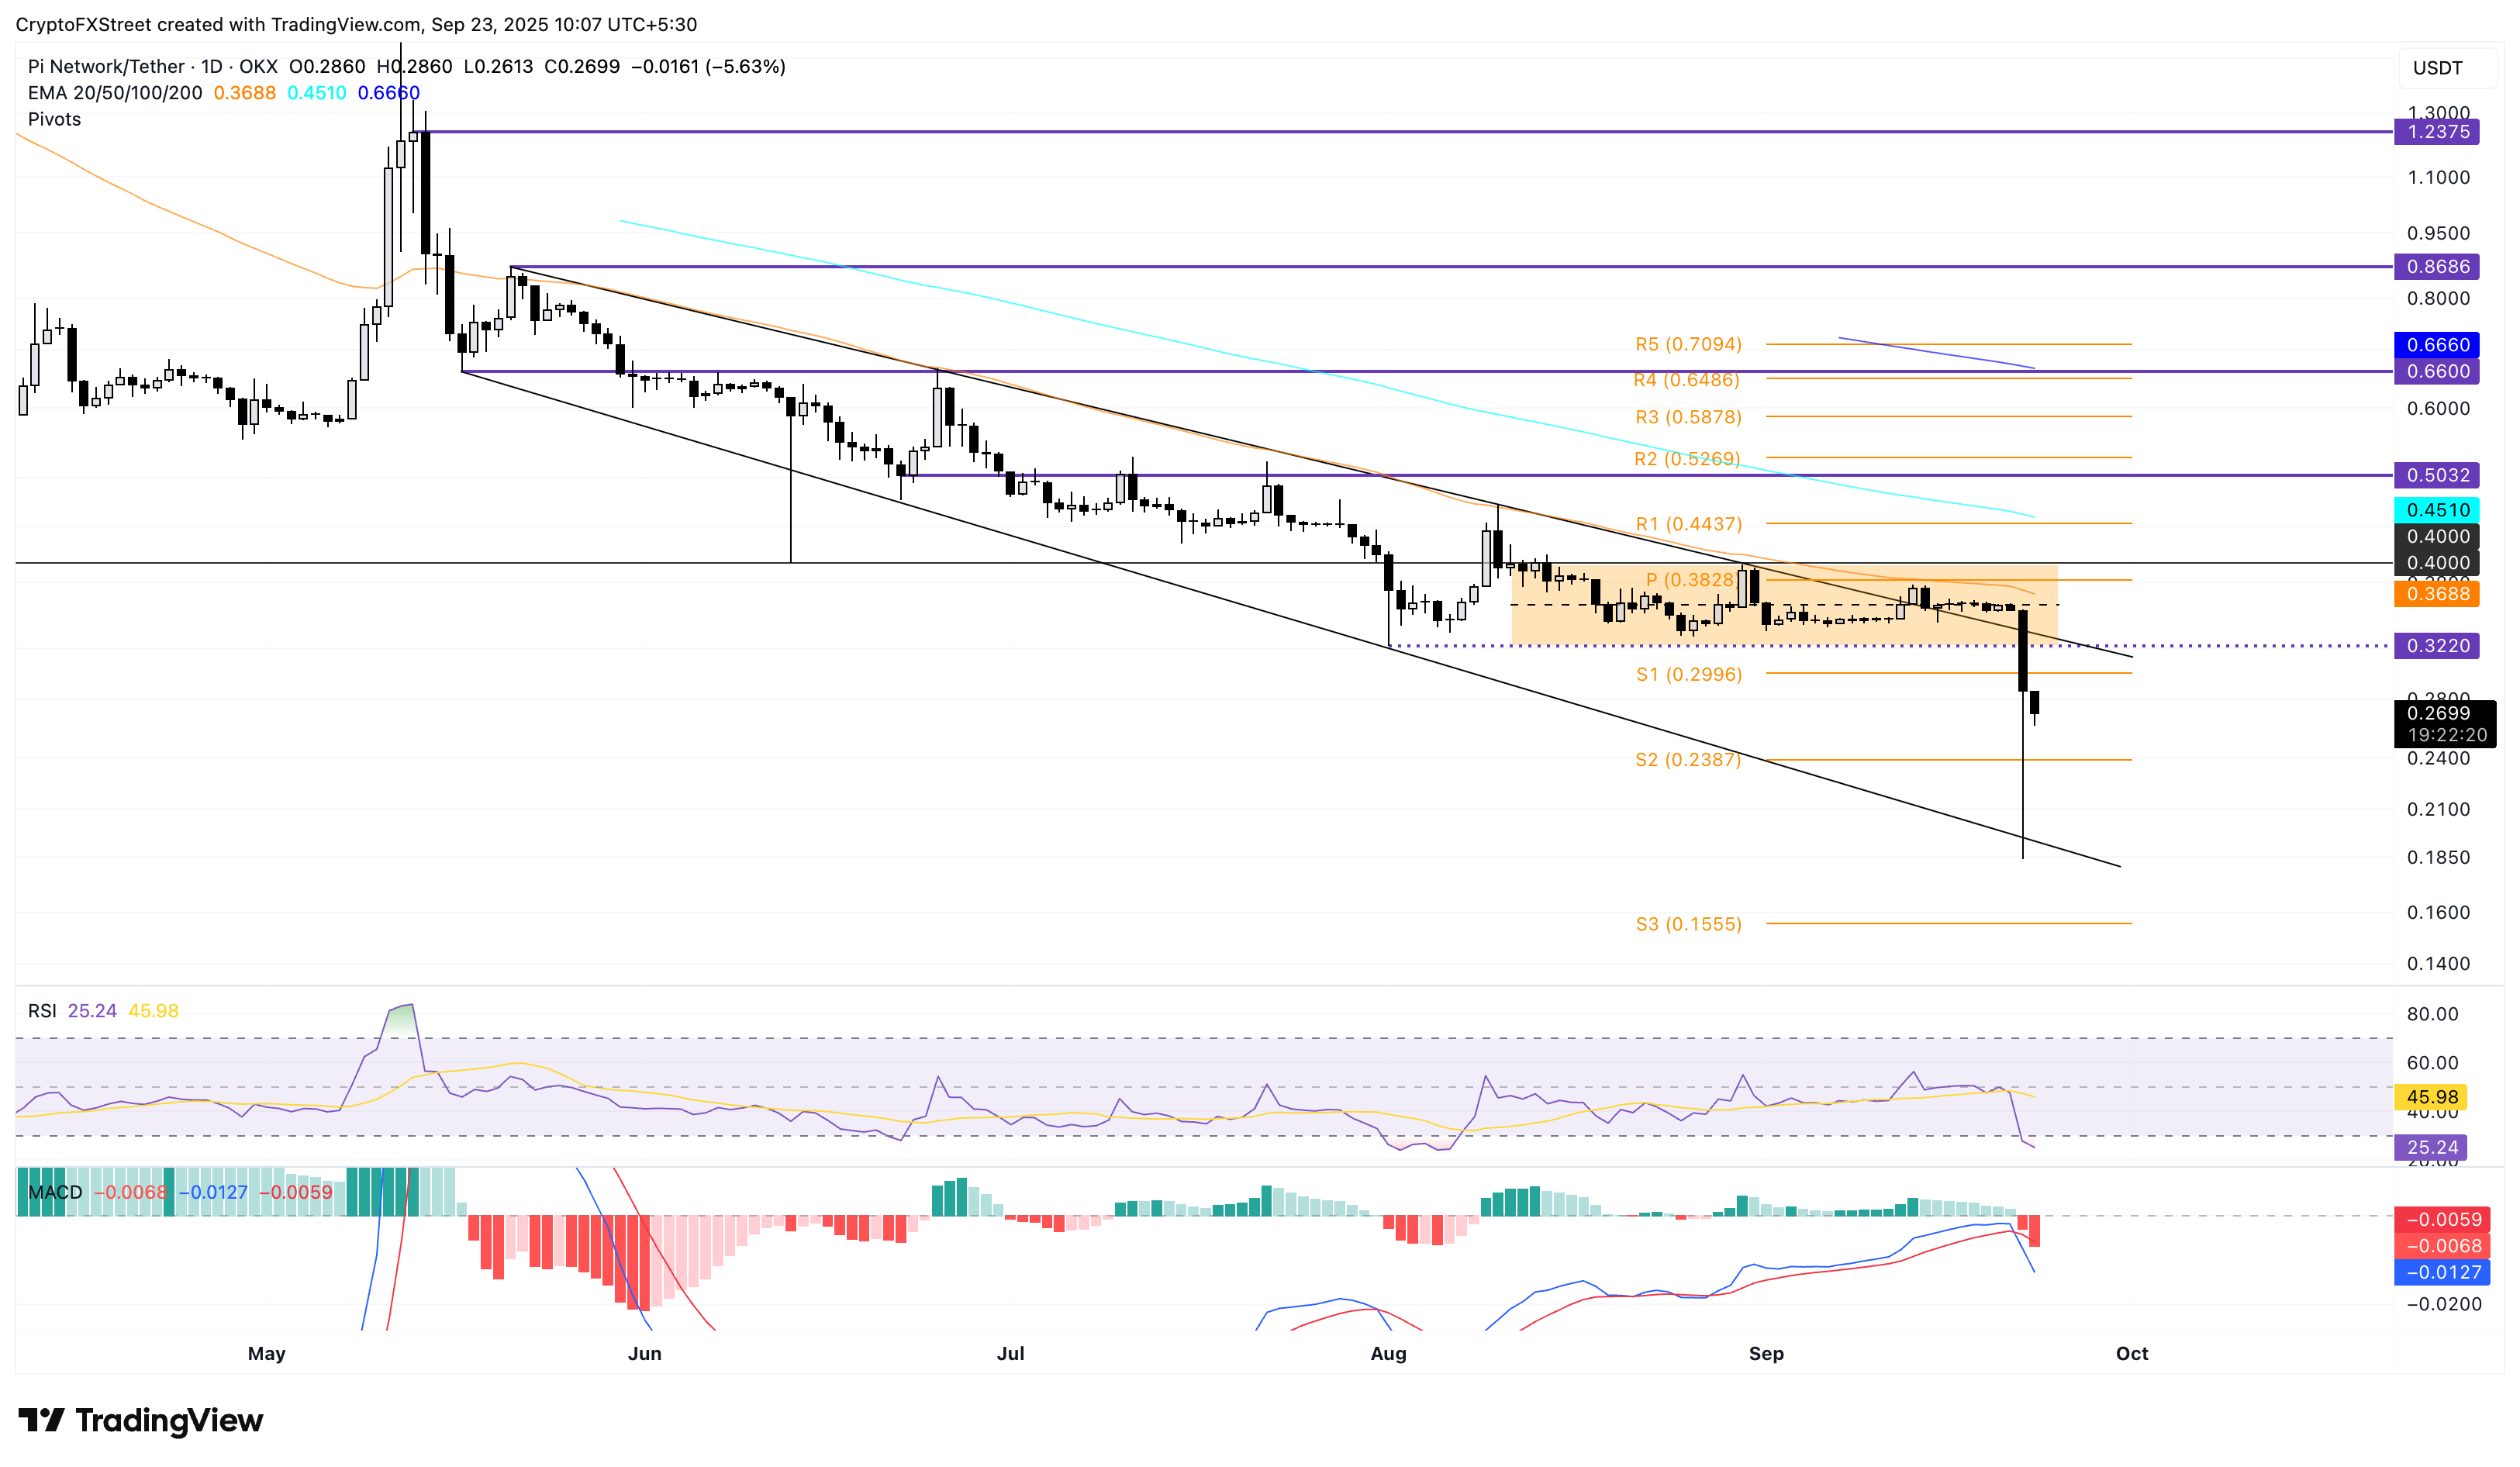
PI/USDT daily price chart.
Looking up, a potential bounce back above the S1 pivot level, a support-turned resistance, at $0.2996, could challenge the overhead trendline at $0.3220. Beyond this, the centre pivot level $0.2838 could act as the next key resistance.
Cryptocurrency prices FAQs
Token launches influence demand and adoption among market participants. Listings on crypto exchanges deepen the liquidity for an asset and add new participants to an asset’s network. This is typically bullish for a digital asset.
A hack is an event in which an attacker captures a large volume of the asset from a DeFi bridge or hot wallet of an exchange or any other crypto platform via exploits, bugs or other methods. The exploiter then transfers these tokens out of the exchange platforms to ultimately sell or swap the assets for other cryptocurrencies or stablecoins. Such events often involve an en masse panic triggering a sell-off in the affected assets.
Macroeconomic events like the US Federal Reserve’s decision on interest rates influence crypto assets mainly through the direct impact they have on the US Dollar. An increase in interest rate typically negatively influences Bitcoin and altcoin prices, and vice versa. If the US Dollar index declines, risk assets and associated leverage for trading gets cheaper, in turn driving crypto prices higher.
Halvings are typically considered bullish events as they slash the block reward in half for miners, constricting the supply of the asset. At consistent demand if the supply reduces, the asset’s price climbs.
Author

Vishal Dixit
FXStreet
Vishal Dixit holds a B.Sc. in Chemistry from Wilson College but found his true calling in the world of crypto.



