Pepe Price Forecast: PEPE gains upside traction on rising retail demand
- Pepe is up over 2% on Friday, recovering after a 5% retreat from an overhead resistance trendline the previous day.
- On-chain data show mixed whale activity as PEPE's supply on exchanges broadly declines, suggesting neutral-to-bullish signals.
- PEPE retains firm retail strength, with its futures Open Interest up 2% in 24 hours.


Pepe (PEPE) shows signs of recovery on Friday after a 5% decline the previous day, which keeps the price trapped in a symmetrical triangle pattern. The frog-themed meme coin struggles to retain its appeal among large-wallet investors, while its retail strength remains firm with its futures Open Interest rising. The technical outlook for PEPE suggests an upside bias as momentum strengthens, supporting the odds of a triangle breakout rally.
Retail strength offsets mixed on-chain demand
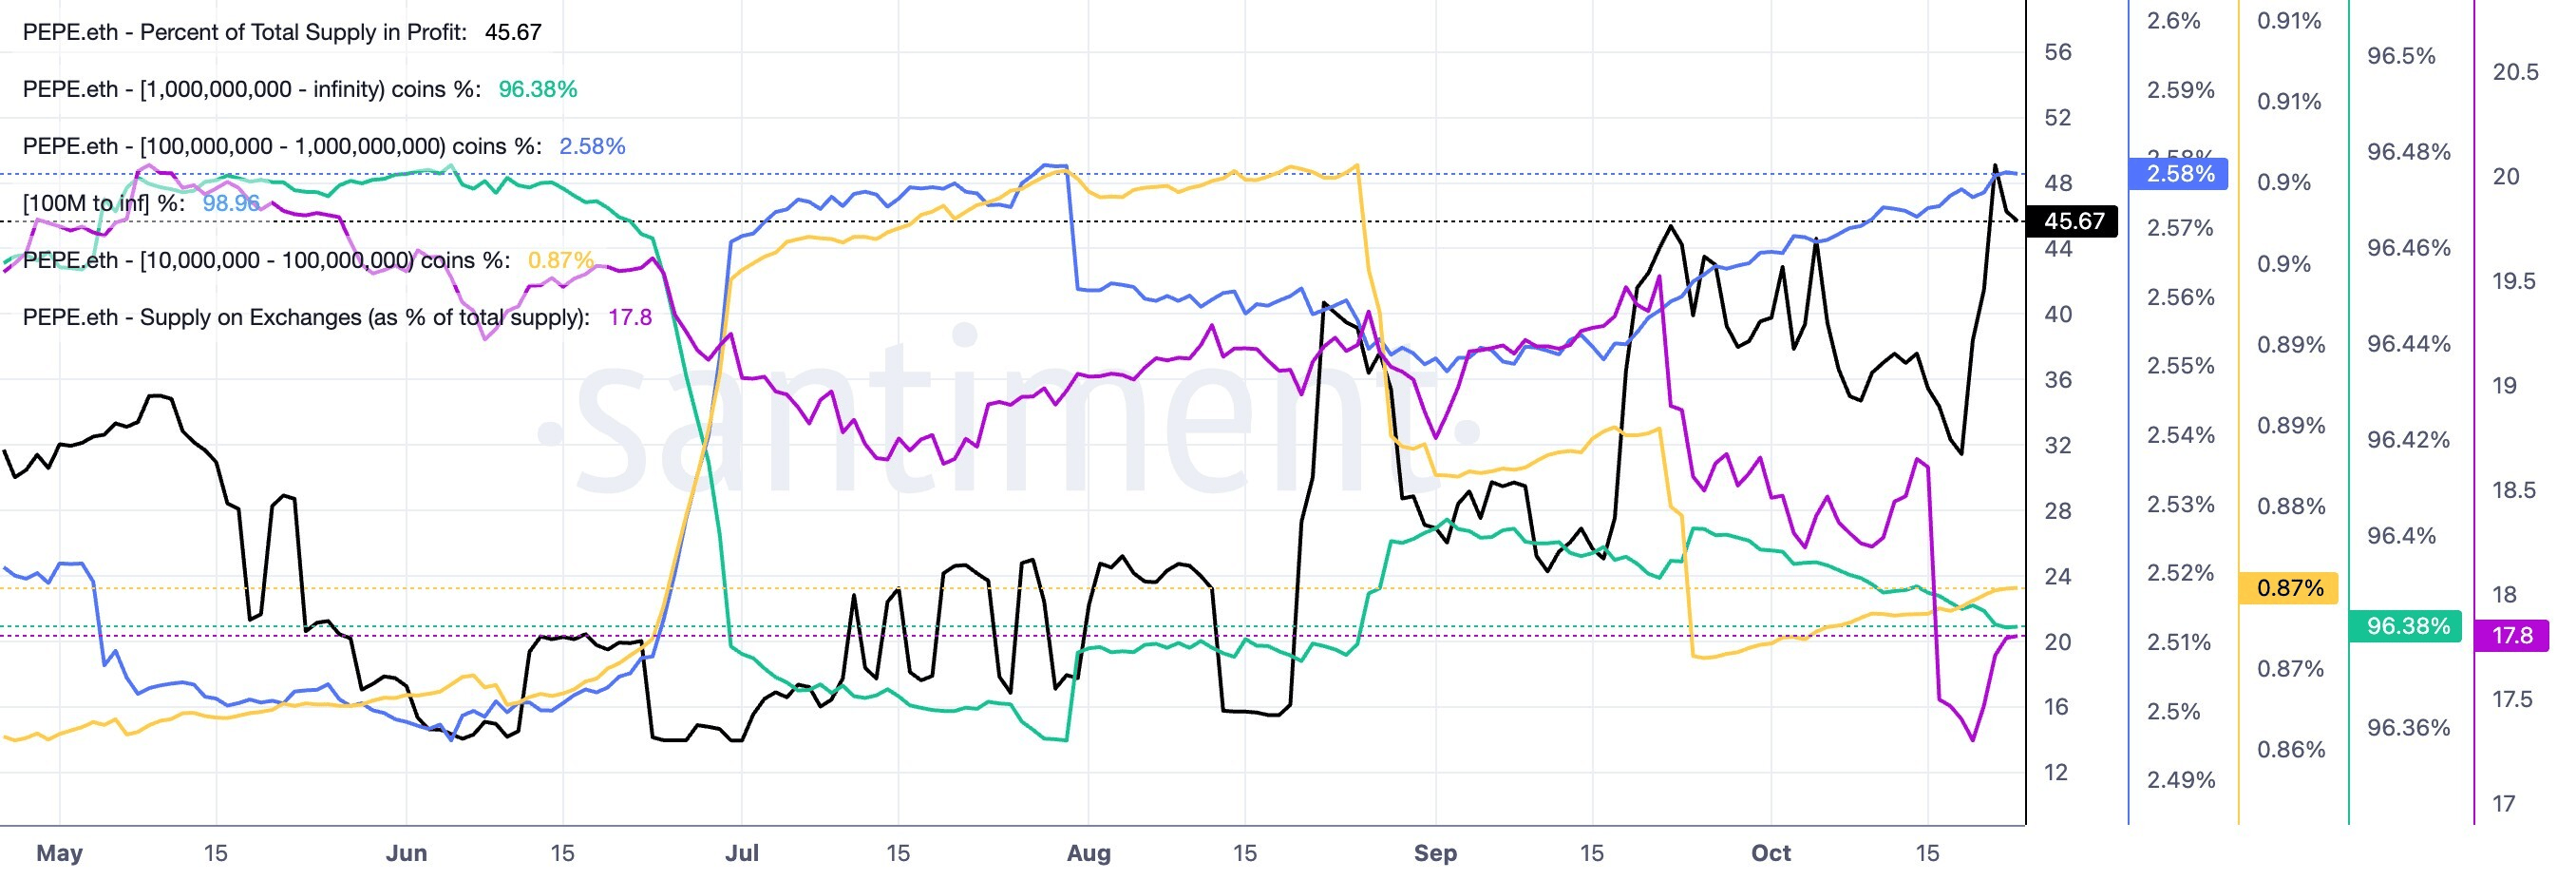
Pepe on-chain data shows mixed signals as broader market uncertainty weighs on whales. Whales holding over 1 billion PEPE tokens account for 96.38% of the circulating supply on Friday, down from 96.4% on September 1, while cohorts holding 100 million to 1 billion PEPE continue to expand their holdings to 2.56% of the circulating supply, up from 2.55% in the same period.
At the same time, PEPE supply on exchanges has dropped to 17.8%, from 18.75%, suggesting that the selling pressure has eased. Meanwhile, the supply in profit has increased to 45.67%, reflecting steady near-term recovery but also raising profit-booking concerns.
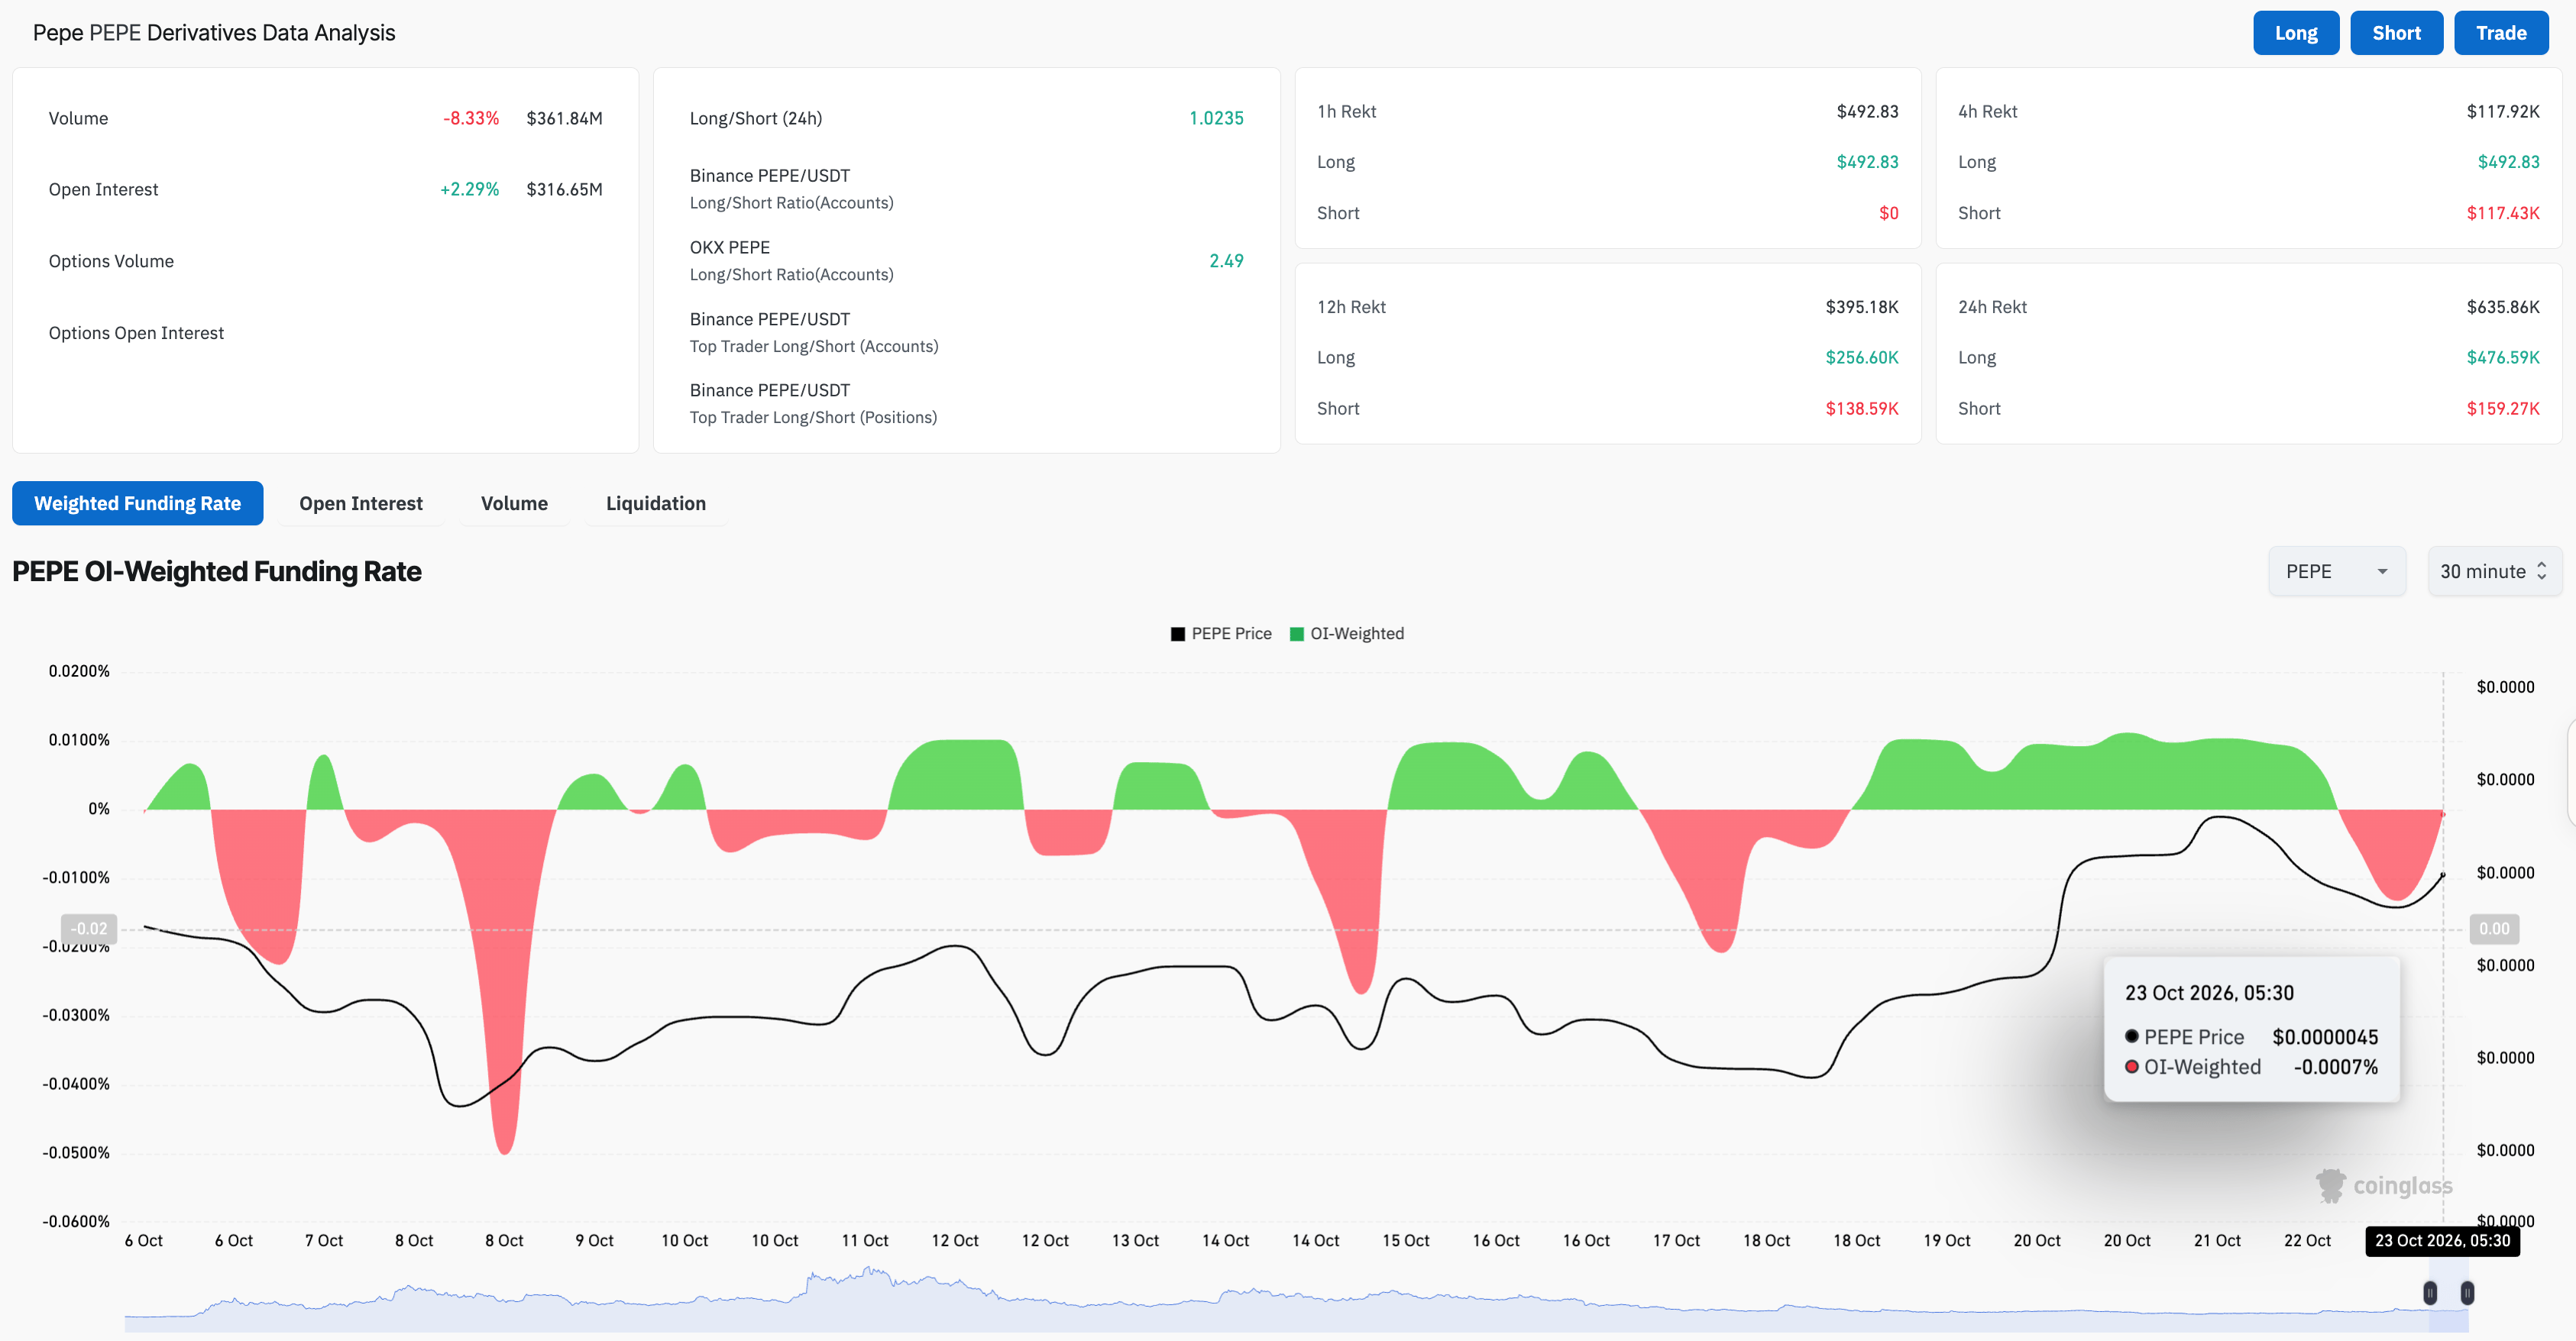
On the retail side, Pepe futures continue to face firm buying pressure. According to CoinGlass, PEPE futures Open Interest is up 2% over the last 24 hours, suggesting a buildup in open positions as the spot price stalls. In addition, the funding rate has increased to -0.0078%, up from -0.0133%, suggesting that the appeal for buying short positions has eased over the last 24 hours.
Technical Analysis: Will PEPE extend a triangle breakout rally?
Pepe trades around $0.00000450 at press time on Friday, nearly recovering the 5% losses from the previous day. PEPE price trails an overhead resistance trendline, connecting the September 22 and Wednesday highs, around $0.00000476.
From a technical perspective, the overhead trendline and a rising support trendline connecting the September 11 and October 8 lows near $0.00000396 form a symmetrical triangle pattern. A confirmed breakout above the resistance trendline near $0.00000476 could extend the rally toward the $0.00000536 peak from September 22. Fibonacci retracement from the September 11 low at $0.00000320 to the September 22 high at $0.00000536 highlights the 127.2% and 161.8% Fibonacci extension levels at $0.00000617 and $0.00000737, respectively, as the next key hurdles.
Momentum gains strength on the daily chart, with the Moving Average Convergence Divergence (MACD) rising above its signal line in positive territory, while the Relative Strength Index (RSI) at 60 crosses above the midline, signaling further upside before reaching the overbought zone.
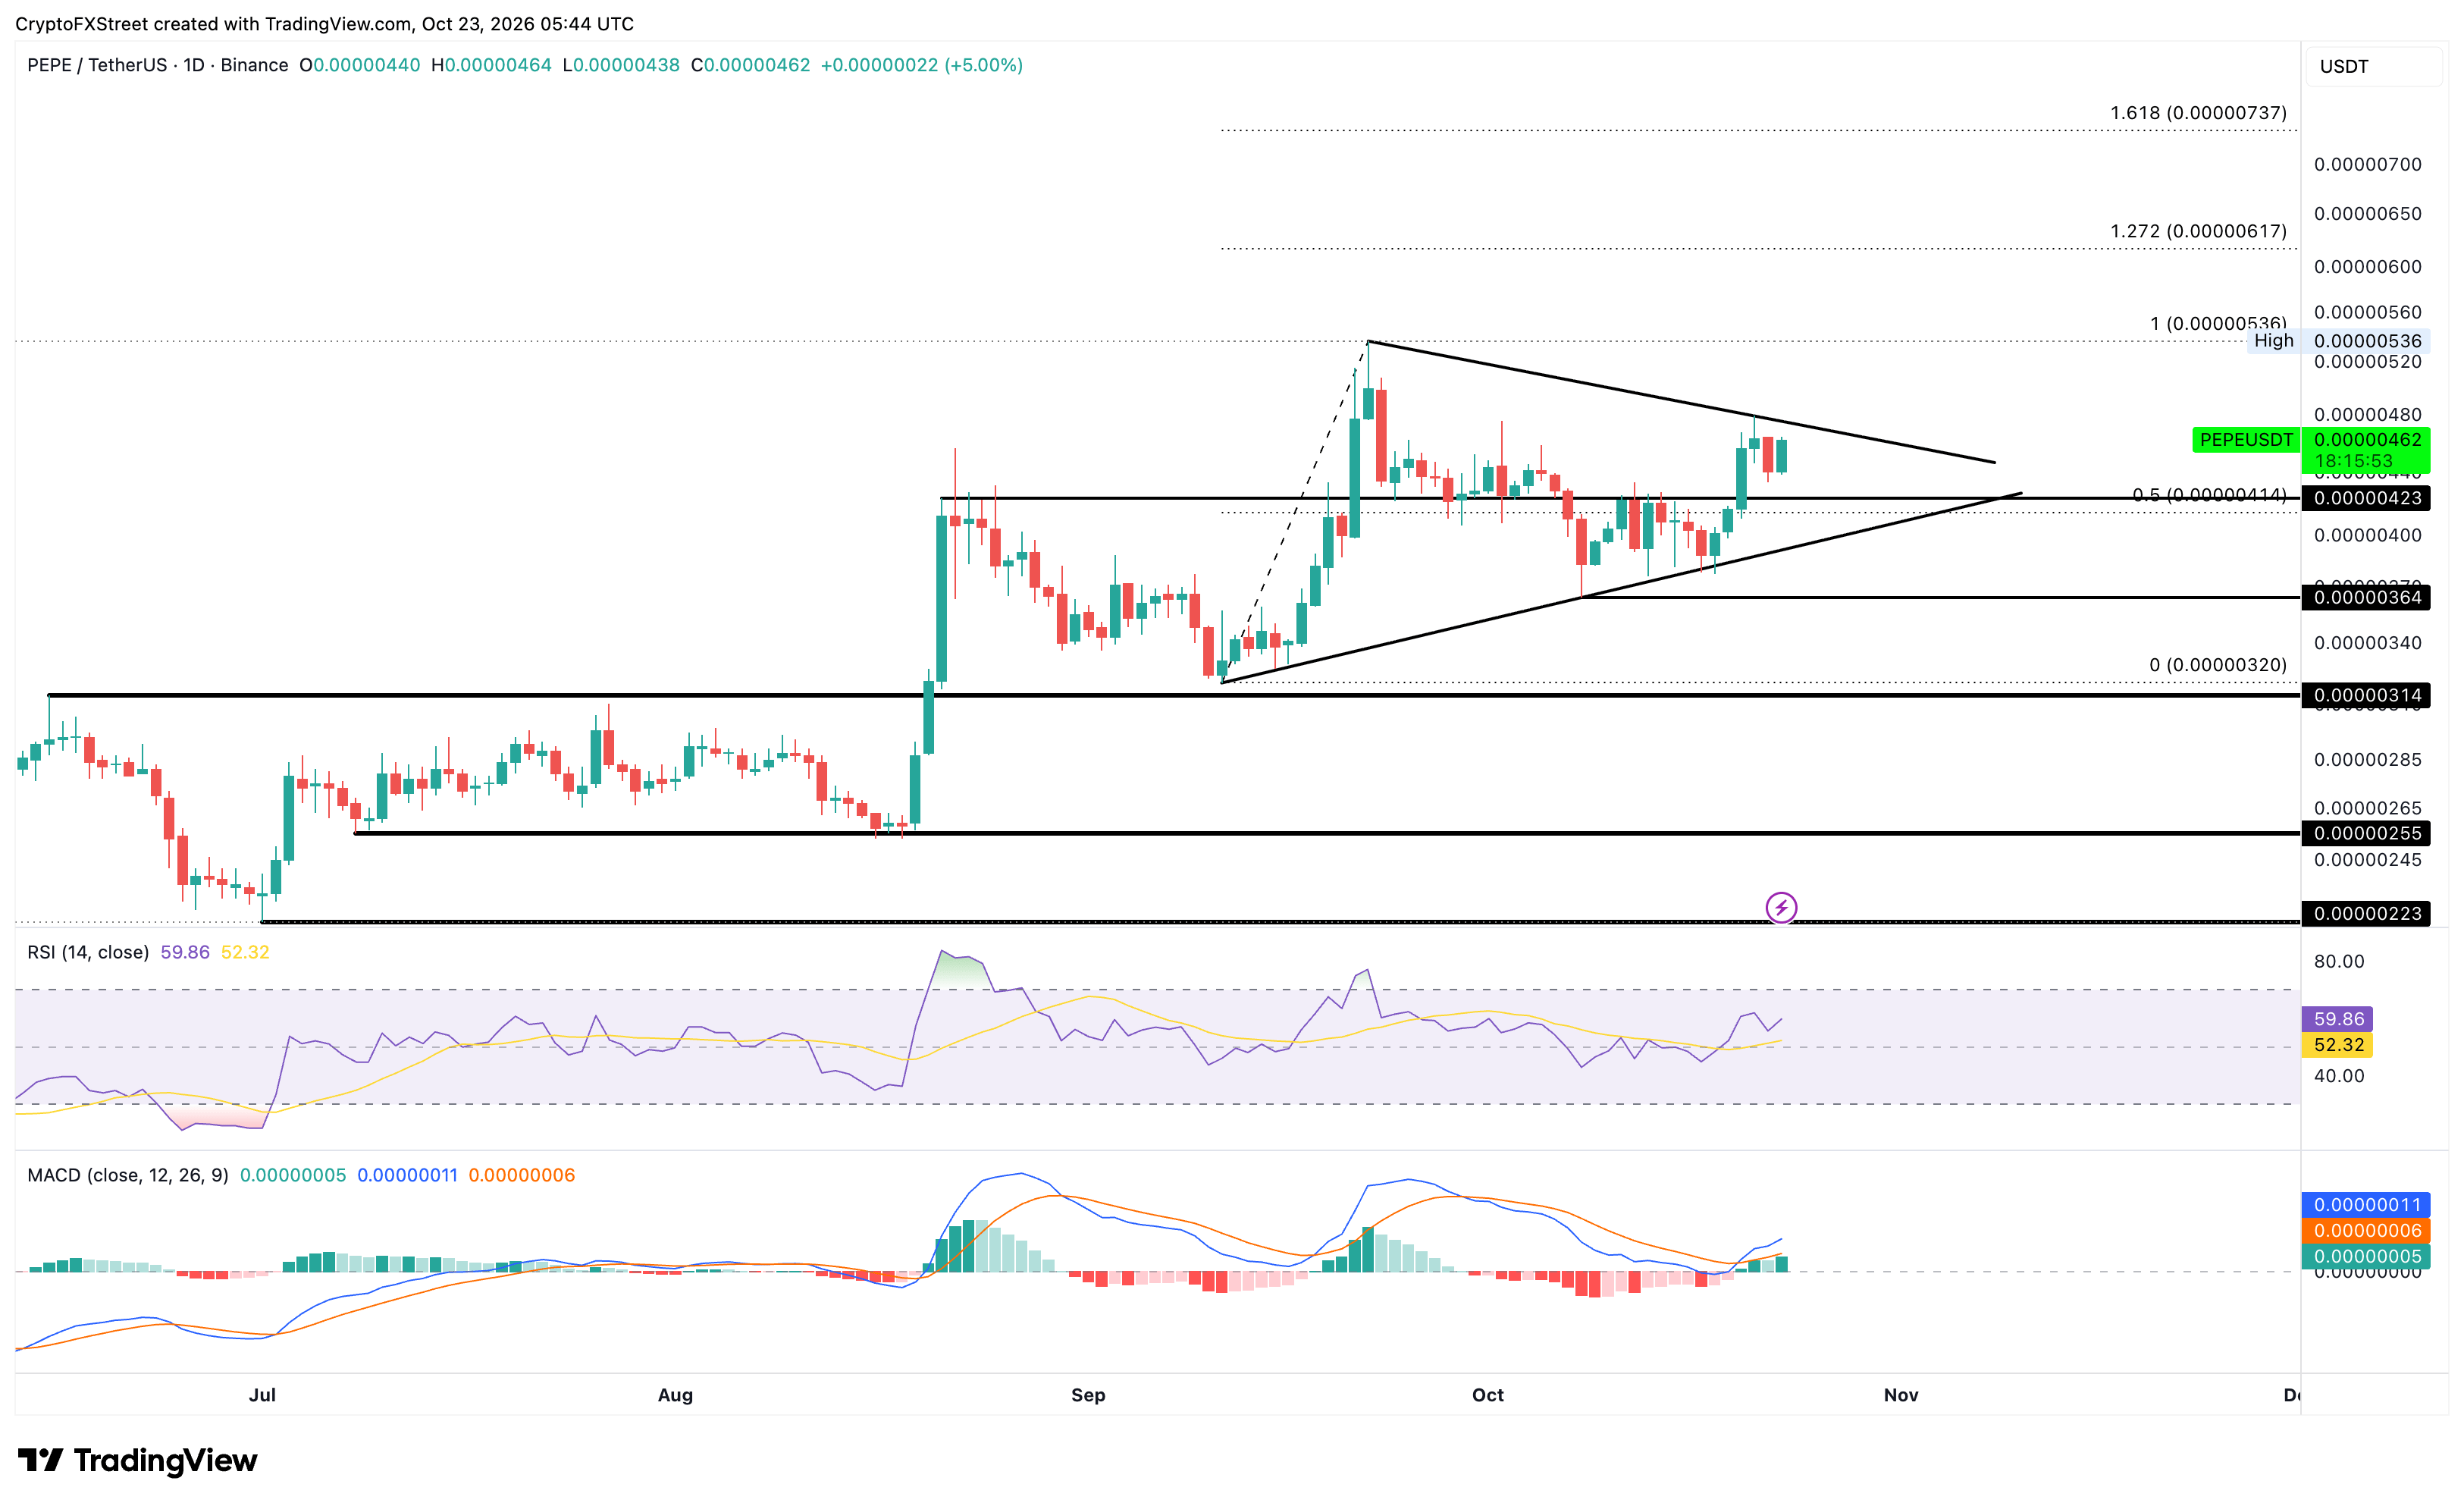
On the downside, the 50% retracement level at $0.00000414 and the October 8 low at $0.00000364 emerge as the support levels.
(The technical analysis of this story was written with the help of an AI tool. Know more.)
Cryptocurrency prices FAQs
Token launches influence demand and adoption among market participants. Listings on crypto exchanges deepen the liquidity for an asset and add new participants to an asset’s network. This is typically bullish for a digital asset.
A hack is an event in which an attacker captures a large volume of the asset from a DeFi bridge or hot wallet of an exchange or any other crypto platform via exploits, bugs or other methods. The exploiter then transfers these tokens out of the exchange platforms to ultimately sell or swap the assets for other cryptocurrencies or stablecoins. Such events often involve an en masse panic triggering a sell-off in the affected assets.
Macroeconomic events like the US Federal Reserve’s decision on interest rates influence crypto assets mainly through the direct impact they have on the US Dollar. An increase in interest rate typically negatively influences Bitcoin and altcoin prices, and vice versa. If the US Dollar index declines, risk assets and associated leverage for trading gets cheaper, in turn driving crypto prices higher.
Halvings are typically considered bullish events as they slash the block reward in half for miners, constricting the supply of the asset. At consistent demand if the supply reduces, the asset’s price climbs.
Author
Vishal Dixit
FXStreet
Vishal Dixit holds a B.Sc. in Chemistry from Wilson College but found his true calling in the world of crypto.