Meme Coins Price Prediction: Dogecoin, Shiba Inu, Pepe – Profit-taking cools last week’s rally
- Dogecoin edges higher on Wednesday after two consecutive days of roughly 10% losses.
- Shiba Inu holds above a key psychological support despite facing a 5% pullback earlier this week.
- Pepe faces downside pressure after a 5% decline the previous day, as the price remains capped below a long-term resistance trendline.

Meme coins, including Dogecoin (DOGE), Shiba Inu (SHIB), and Pepe (PEPE), are losing their bullish momentum after last week’s double-digit gains. Facing downside pressure amid profit-taking, DOGE and PEPE risk further decline while SHIB holds at a support level.
Dogecoin remains capped below $0.10
Dogecoin trades around $0.0860 at press time on Wednesday, reflecting a pullback phase as last week's 35% rally capped near the $0.1000 psychological level. DOGE also holds above the 50-day Exponential Moving Average (EMA) at $0.0771 but remains below the 200-day EMA at $0.0956.
A confirmed breakout above the 200-day EMA at $0.0956 and $0.1000 could reinstate its upward trend, potentially targeting the $0.1161 supply zone.
The Moving Average Convergence Divergence (MACD) stays in positive territory with a modestly positive histogram, while the Relative Strength Index (RSI) at 65 signals firm upside momentum as it exits the overbought zone.
On the downside, initial support is seen at the February 6 low at $0.0800, followed by the 50-day EMA near $0.0771, a zone that would need to hold to preserve the broader constructive structure.
Shiba Inu holds a key support
Shiba Inu edges higher on Wednesday, recovering after two consecutive days of losses. The 78.6% Fibonacci retracement of the $0.00000670 to $0.00000405 downswing at $0.00000602 capped last week's 25% rally, resulting in a pullback to the 50% retracement at $0.00000521.
The MACD and signal line remain in positive territory, while declining positive histograms suggest cooling bullish momentum. At the same time, the RSI at 59 approaches the neutral zone from overbought territory, reaffirming reduced buying pressure.
A potential rebound in SHIB must confirm the 78.6% retracement breakout at $0.00000602 to open the path toward the $0.00000670 swing high.
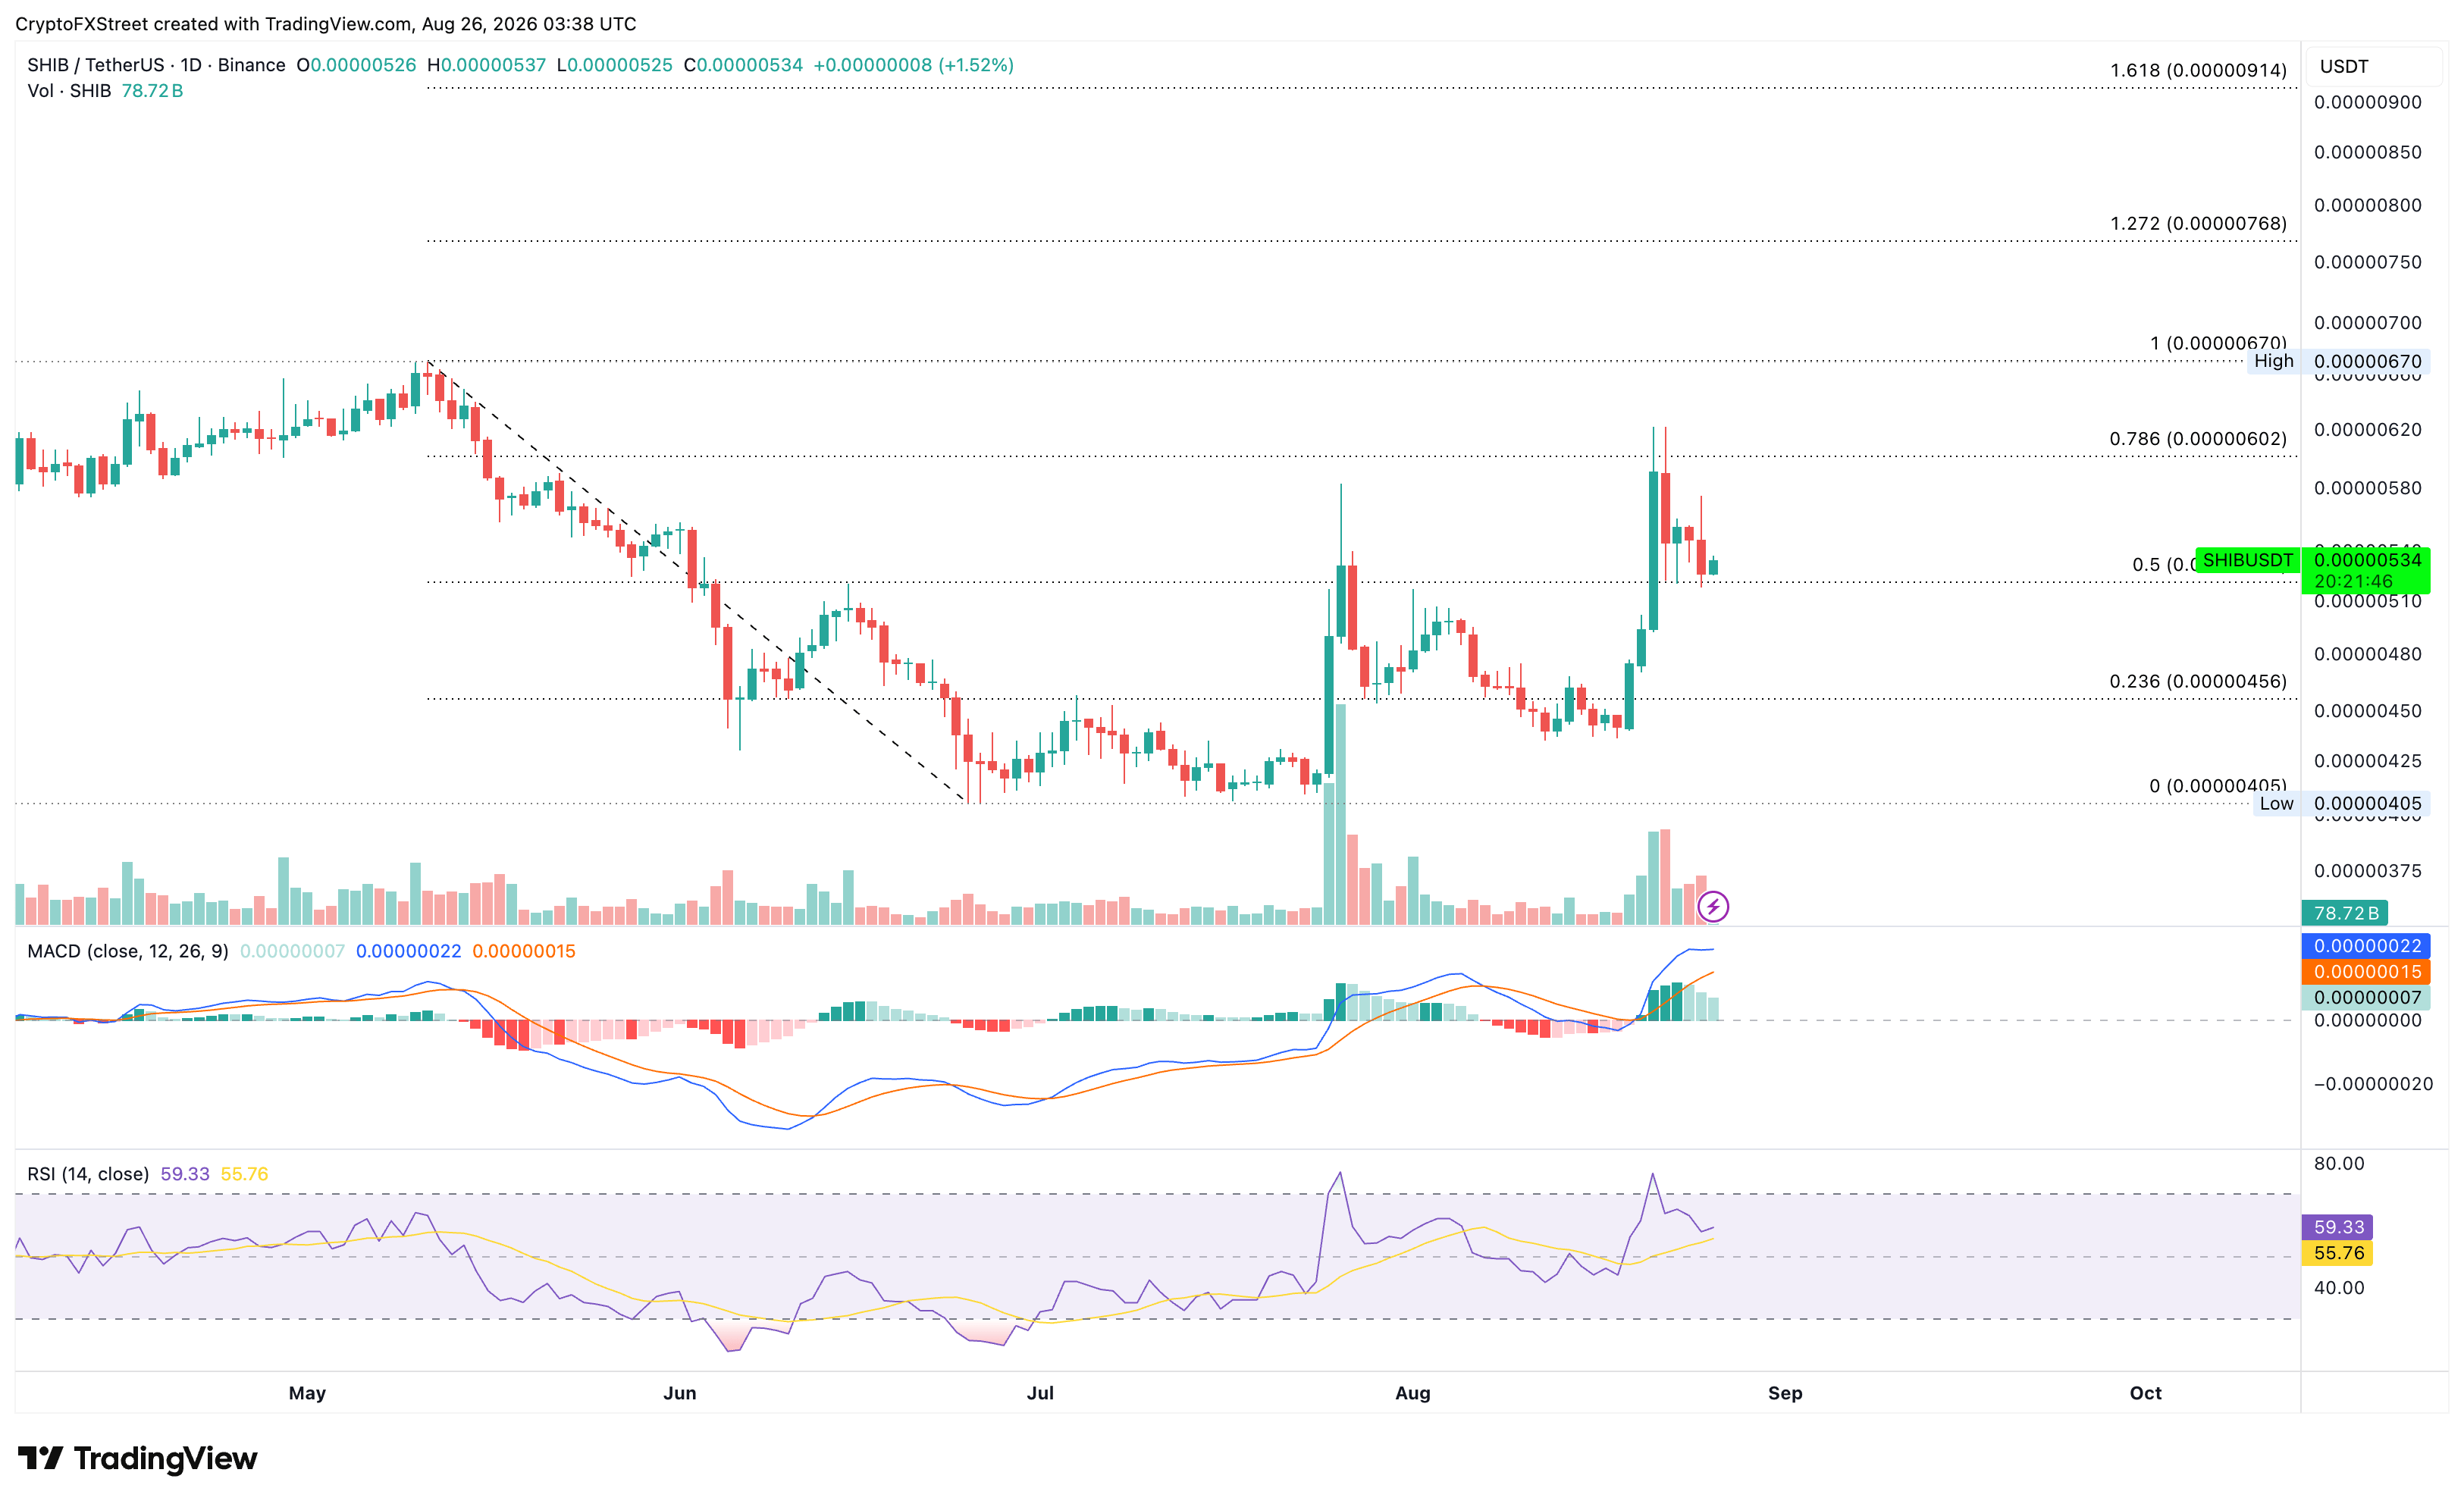
A confirmed breakout below $0.00000521 could deepen the losses, with bears eyeing the 23.6% Fibonacci retracement at $0.00000456, followed by the $0.00000402 swing low.
Pepe remains capped under a long-term resistance trendline
Pepe trades below $0.00000400 on Wednesday, following a 5% decline the previous day. The frog-themed meme coin's 60% rally last week was capped by a long-term resistance trendline connecting the highs of July 22, 2025, and September 13, 2025, near $0.00000456, maintaining a long-term bearish bias.
From a technical perspective, PEPE must surpass Saturday's $0.00000456 high to confirm the trendline breakout. A potential breakout rally could target the November 4 low at $0.00000521, followed by the October 20 high at $0.00000732.
The RSI at 69 shows a reversal from the overbought zone, suggesting reduced buying pressure, while the declining MACD histogram reaffirms the cooling off, with the average lines remaining positive.
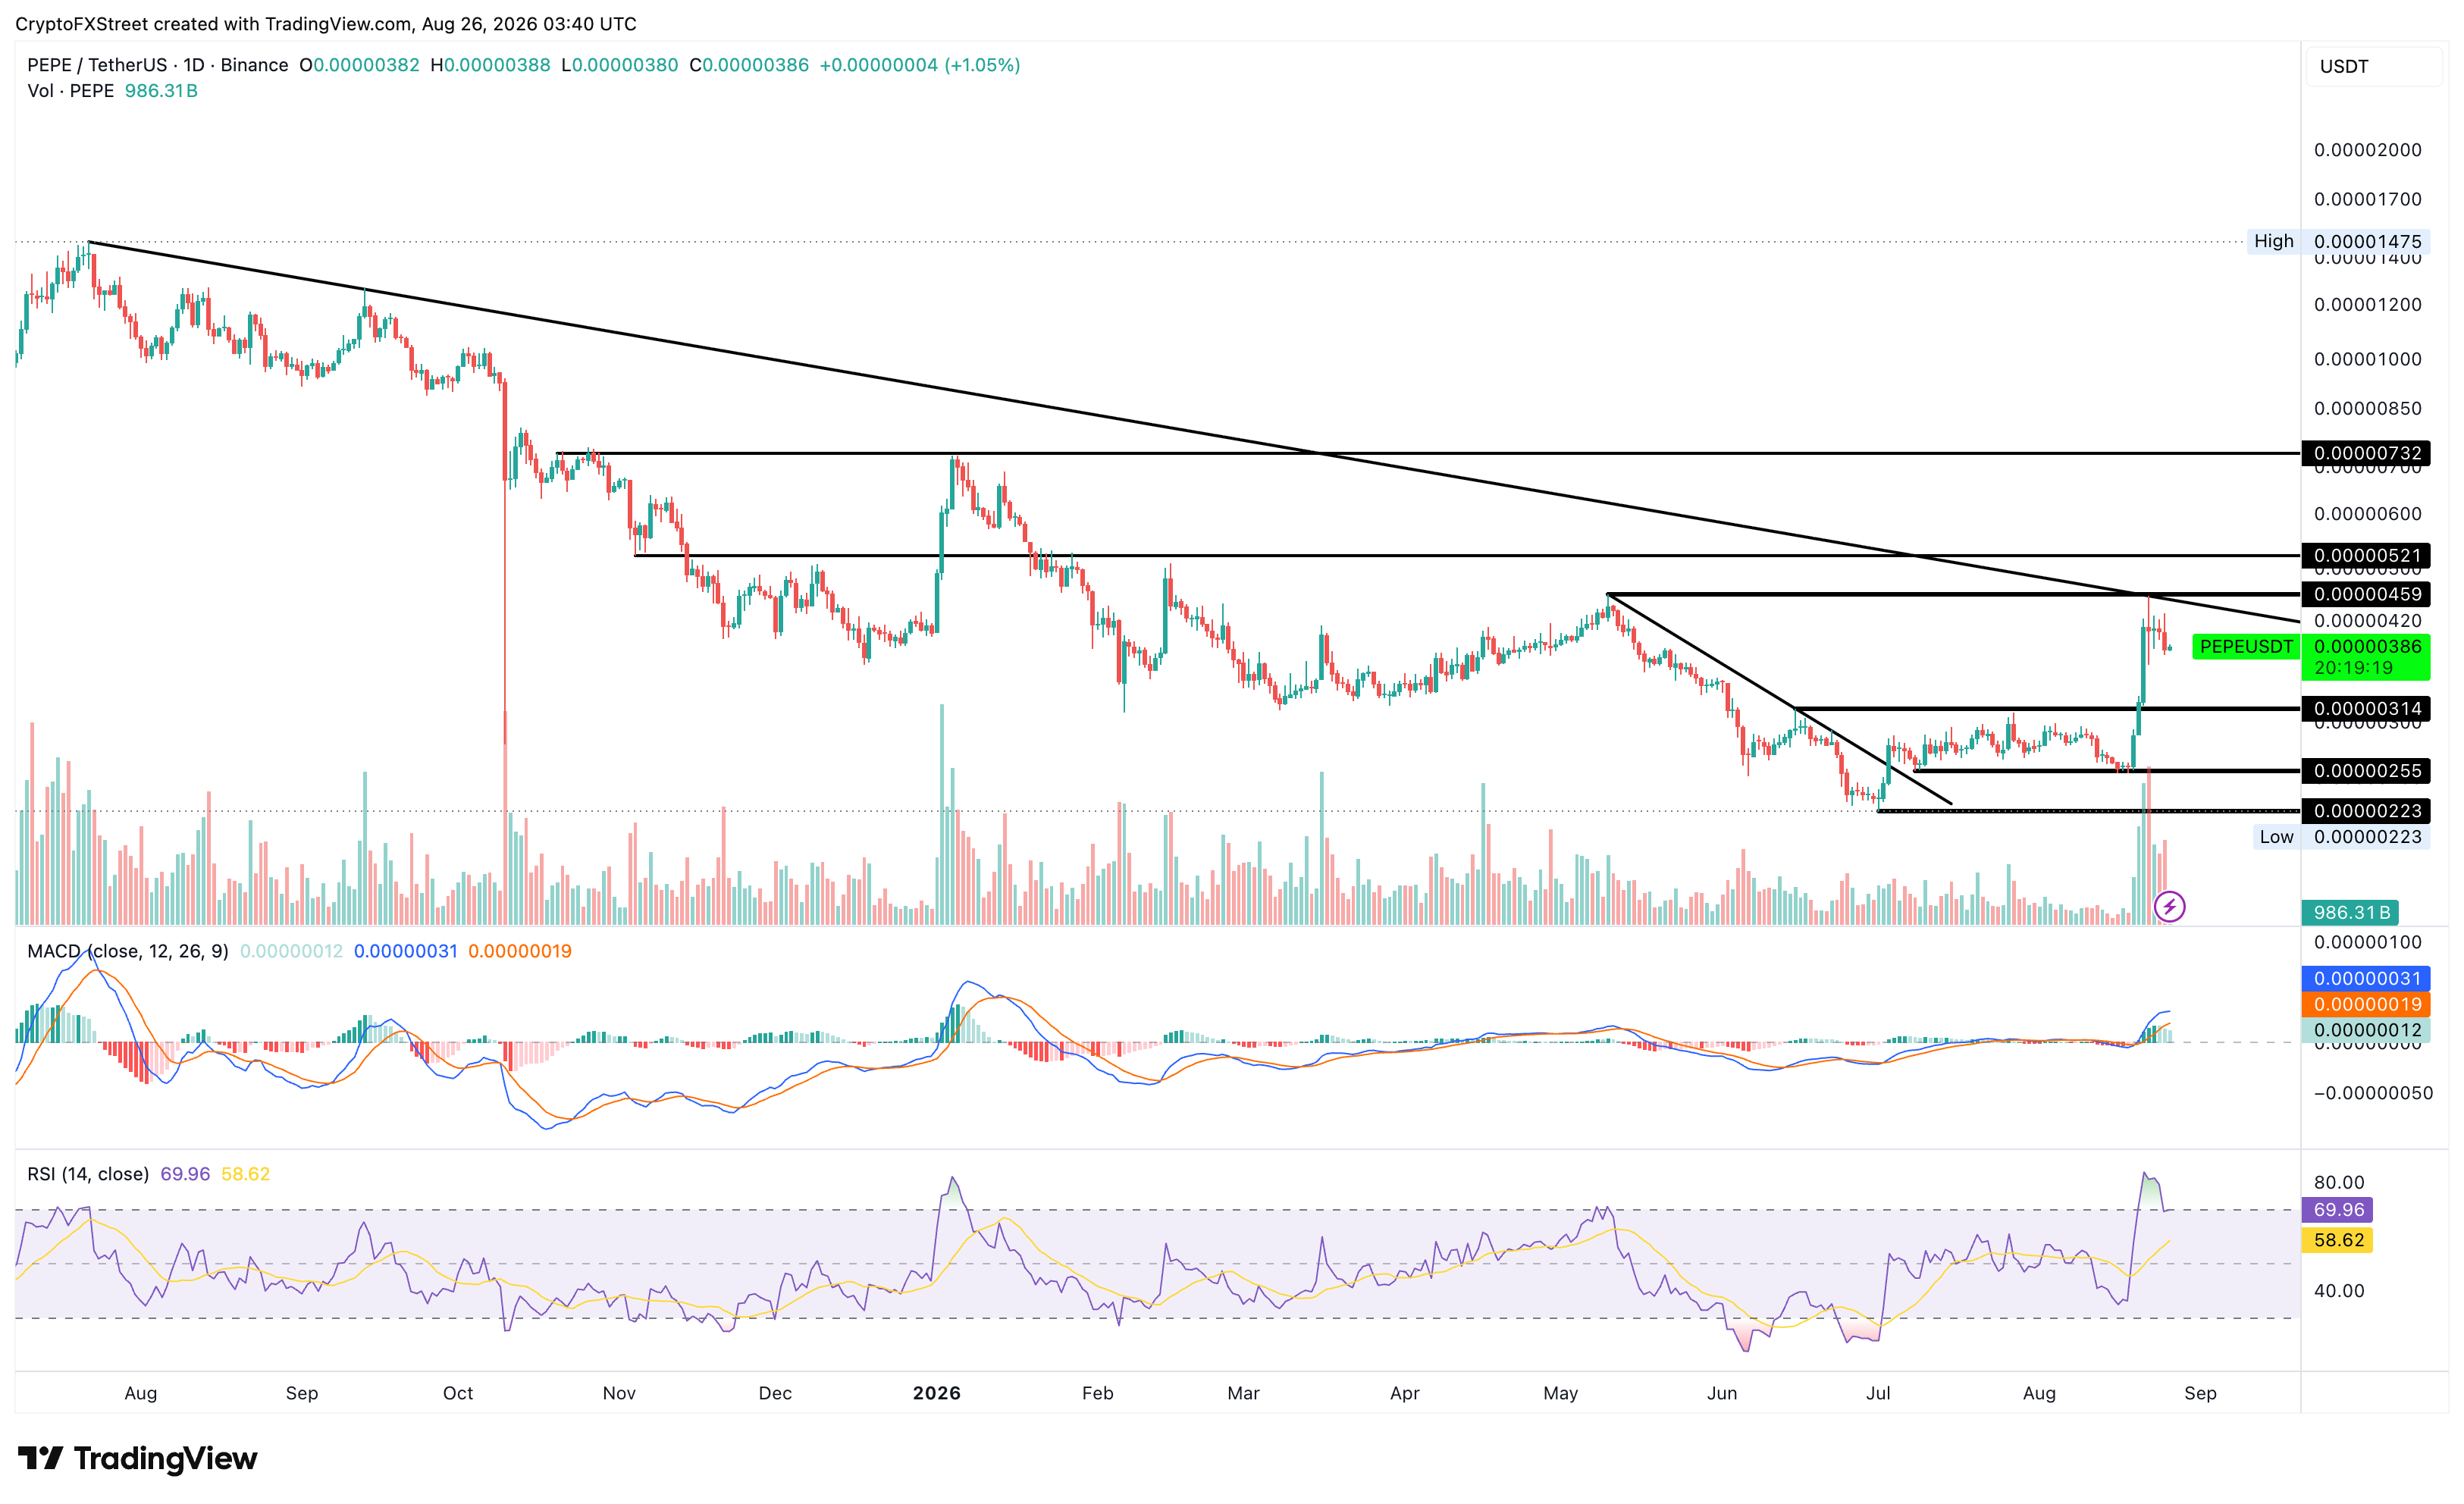
On the downside, the key support for PEPE is at the May 2 high of $0.00000314, where it could attract dip buyers. A deeper decline could target the July 8 low at $0.00000255.
(The technical analysis of this story was written with the help of an AI tool. Know more.)
Author

Vishal Dixit
FXStreet
Vishal Dixit holds a B.Sc. in Chemistry from Wilson College but found his true calling in the world of crypto.



