![]() Lorenzo Stroe
Lorenzo Stroe
Independent Analyst
- Kyber Network price had a breakout from an ascending triangle pattern on the 12-hour chart.
- KNC bulls have a target of $3.8 in the long-term with weak resistance ahead.
- The digital asset has a lot of bullish momentum behind it in the short-term.
Kyber Network price had a significant breakout in the past 72 hours from a key pattern. Several indicators show that KNC faces weak resistance ahead with a price target of about $3.8.
Kyber Network price on point to hit $3.8
KNC had a breakout above a key resistance level on the 12-hour chart from an ascending triangle pattern. Kyber Network has a price target of $3.8 in the long-term.
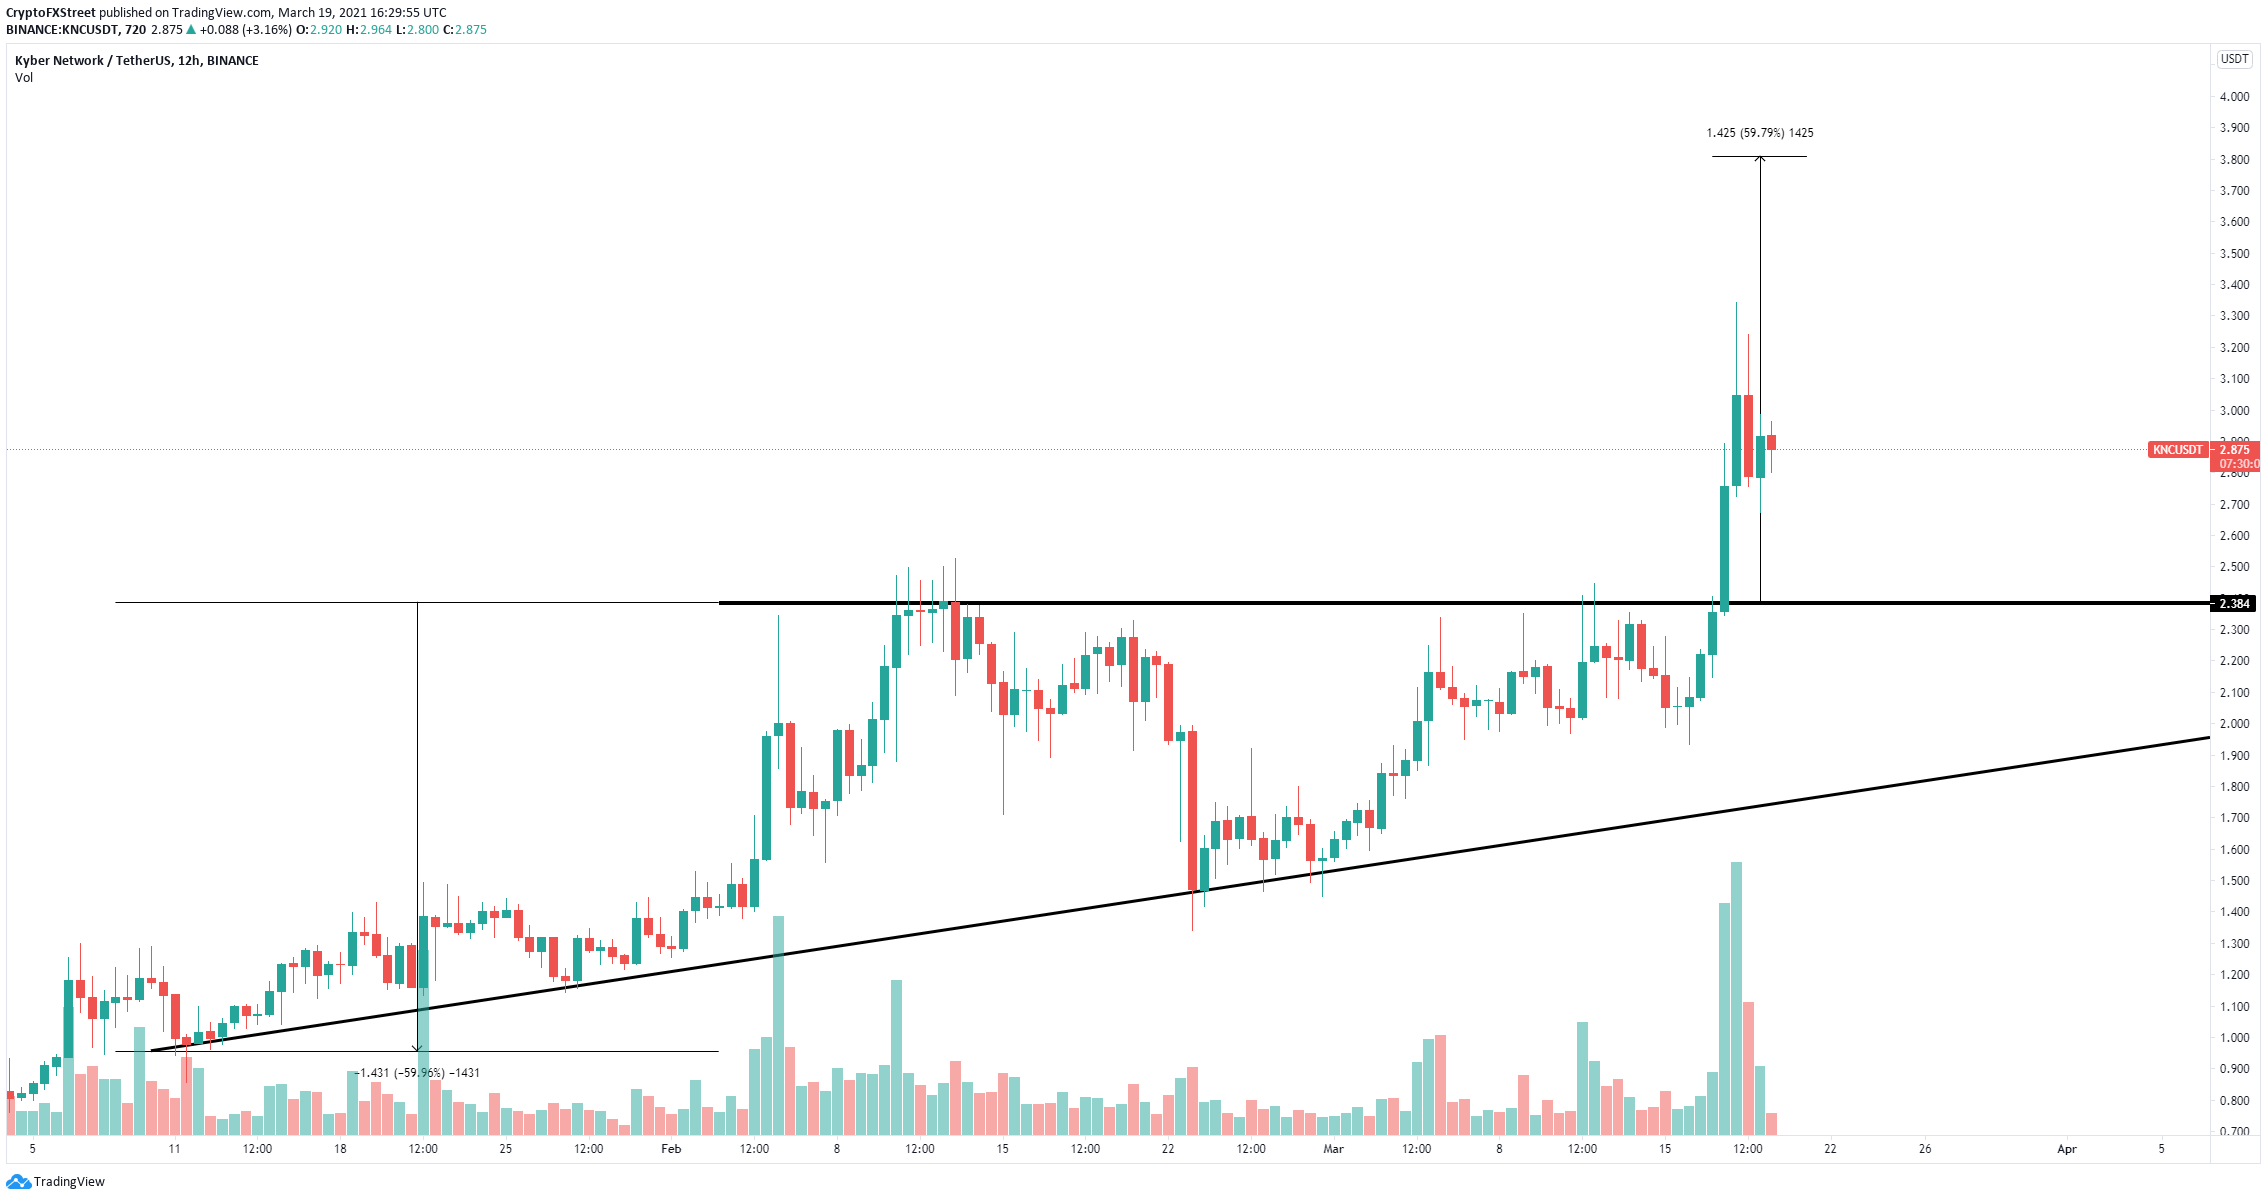
KNC/USD 12-hour chart
Using the height of the pattern as a reference point, KNC should jump towards $3.8. The In/Out of the Money Around Price (IOMAP) shows only one strong resistance area between $3.03 and $3.10. A breakout above this point should drive Kyber Network price towards the last high of $3.34 and then eventually to $3.8.
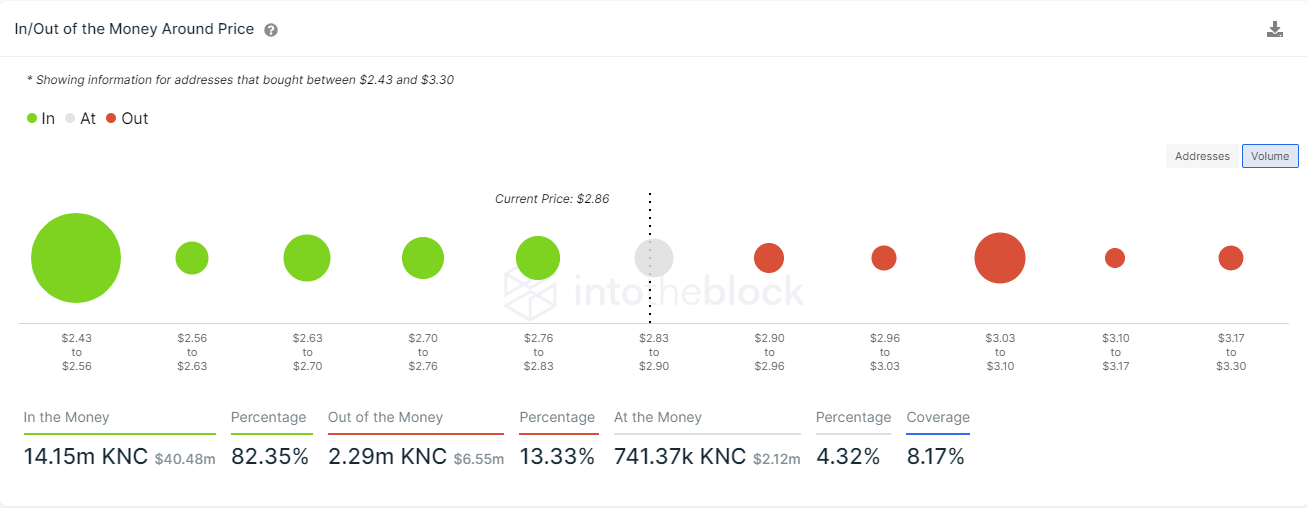
KNC IOMAP chart
On the other hand, KNC could drop towards the previous resistance trendline at $2.38.
Note: All information on this page is subject to change. The use of this website constitutes acceptance of our user agreement. Please read our privacy policy and legal disclaimer. Opinions expressed at FXstreet.com are those of the individual authors and do not necessarily represent the opinion of FXstreet.com or its management. Risk Disclosure: Trading foreign exchange on margin carries a high level of risk, and may not be suitable for all investors. The high degree of leverage can work against you as well as for you. Before deciding to invest in foreign exchange you should carefully consider your investment objectives, level of experience, and risk appetite. The possibility exists that you could sustain a loss of some or all of your initial investment and therefore you should not invest money that you cannot afford to lose. You should be aware of all the risks associated with foreign exchange trading, and seek advice from an independent financial advisor if you have any doubts.
Recommended Content
Editors’ Picks
Here are the best and worst-performing cryptocurrencies in H1 2024

A recent report by Crypto Koryo on Wednesday revealed meme coins as the top performers among cryptocurrencies so far in 2024, with several altcoins coming in behind. The worst-performing tokens are DeFi and governance tokens.
Ethereum poised to follow Nvidia's steps as Bitwise files updated S-1 draft
Ethereum (ETH) is down 3% on Wednesday following Bitwise filing an updated S-1 draft and a wider market downturn with potential Mt. Gox BTC supply flooding the market.
What to expect from altcoins as ETH ETF approval draws closer

As the crypto market continues consolidating on Wednesday, altcoins show mixed signals ahead of the spot ETH ETF launch. Many have predicted that the alt season may not occur in this cycle following the market lull. However, two key metrics suggest otherwise.
PolitiFi meme coins surge as Biden support lowers

Crypto prediction markets favor Kamala Harris over President Joe Biden as Democratic nominee in upcoming presidential elections. Meme coins based on Vice President Harris rallied amid BODEN token's 30% decline. Other tokens based on possible replacements for Biden experienced similar surges.
Bitcoin: BTC price correction could end in July, according to seasonal data

Bitcoin (BTC) price appears poised for a decline this week, influenced by slight outflows in US spot ETFs, selling activity among BTC miners, and a combined transfer of 4,690.28 BTC to centralized exchanges by the US and German governments.