Ethereum Price Forecast: ETH falls below $2,500 as hot CPI raises Fed hike odds

Ethereum price today: $2,430
- Ethereum dropped below $2,500 after the US September CPI inflation reading came in hotter than expected.
- Selling pressure is evident across derivatives and spot markets, with rising liquidations and exchange inflows.
- ETH is facing pressure at the dense $2,548 and short-term EMAs' resistance zone.
Ethereum (ETH) extended its decline below $2,500 on Wednesday after a hotter-than-expected US inflation print renewed selling across the crypto market. At the time of writing, the top altcoin trades near $2,430, down 3.1% in the past 24 hours.
Hot inflation print pressures ETH as derivatives and spot markets show rising selling
The US Consumer Price Index (CPI) for September rose 0.6% monthly, in line with market forecasts and up from a 0.4% increase in August. However, annual headline inflation jumped to 3.7%, up from 3.4% and above expectations of 3.6%.
Core CPI, which excludes volatile energy and food prices, ticked upward to 0.3% monthly and 2.6% annually, both above forecasts of 0.2% and 2.5%.
Following the inflation reading, the US 10Y Treasury yields spiked to 5.32% before easing toward 5.22%.
The US Dollar Index (DXY), which measures the Greenback against a basket of six major currencies, also pushed above 102.80 for the first time since April 2025.
Additionally, odds of the Federal Reserve (Fed) raising interest rates at its October meeting increased from 22% to 35%, according to the CME FedWatch Tool.
Rising Treasury yields increase the opportunity costs of holding risk assets like cryptocurrencies. Also, a higher DXY affects crypto prices as they are predominantly valued in US Dollars, while rising interest rates dry up liquidity for riskier investments.
Ethereum dropped toward $2,430, down 3.1%, following the moves across these defensive tools. The decline resulted in $65.42 million in liquidations over the past 24 hours, with longs accounting for 83%, per Coinglass data. That marks a second straight day of rising long liquidations after the crypto's market whipsaw on Tuesday wiped off $120 million worth of ETH longs.
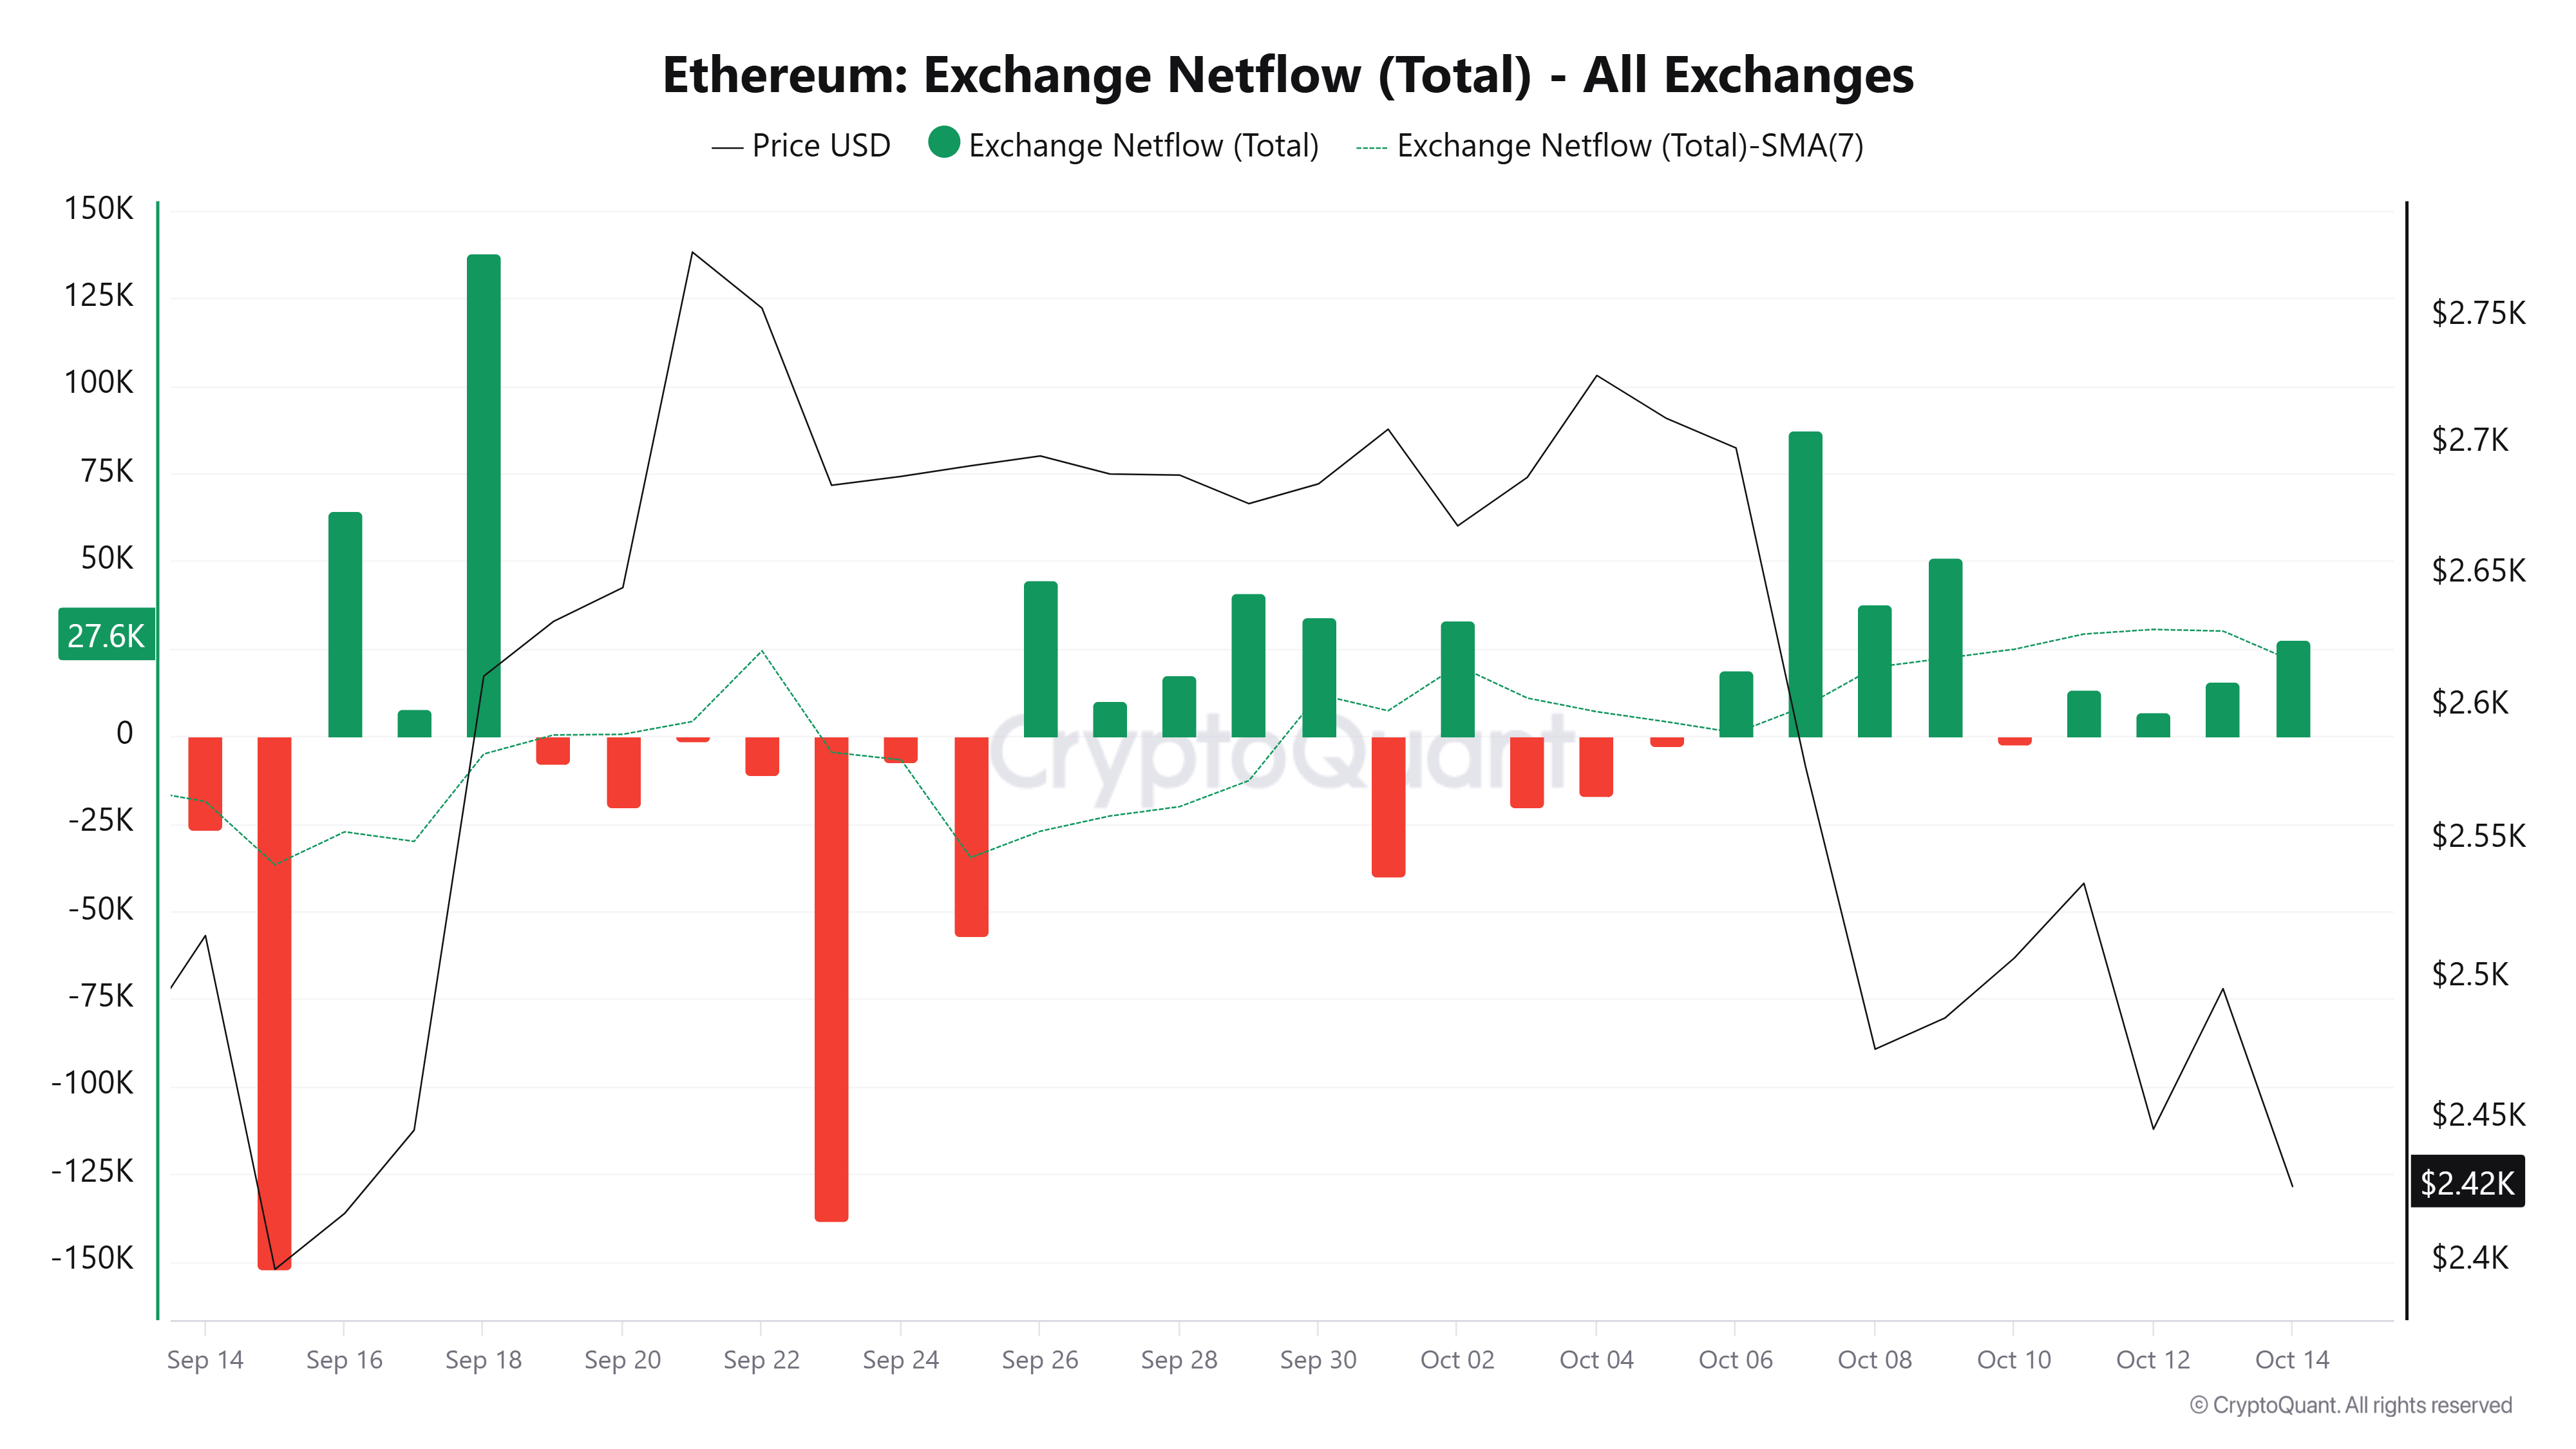
Selling pressure isn't restricted to the derivatives market. ETH Exchange Netflow, which measures the difference between coins flowing in and out of exchanges, has maintained a positive trend since Sunday, similar to last week. The move indicates more coins are entering exchanges than leaving, a signal that has historically correlated with increased selling pressure, as shown in the chart below.
Ethereum technical outlook: ETH struggles at $2,548
On the daily chart, ETH retains a bearish near-term bias as price holds below the 50-day and 20-day Exponential Moving Averages (EMAs) at $2,498 and $2,563, respectively. Although it continues to trade above the 100-day EMA at $2,353, which offers some underlying trend support, a failure to reclaim the short-term EMAs hints at a capped recovery.
The 14-day Relative Strength Index (RSI) sits near 38, while the Stochastic Oscillator (Stoch) hovers around 7, suggesting weak momentum and an oversold tone that could slow, but not yet reverse, the prevailing downside pressure.
On the topside, initial resistance is seen at the 50-day EMA, followed by the horizontal barrier at $2,548 and the 20-day EMA, which together form a dense supply zone before the $2,636 level and the higher cap at $2,781.
On the downside, immediate support aligns with the recent close at $2,432, ahead of the horizontal floor at $2,355 and the 100-day EMA at $2,353, with deeper cushions seen at $2,204 and $1,971 if selling pressure resumes.
(The technical analysis of this story was written with the help of an AI tool. Know more.)
Author

Michael Ebiekutan
FXStreet
With a deep passion for web3 technology, he's collaborated with industry-leading brands like Mara, ITAK, and FXStreet in delivering groundbreaking reports on web3's transformative potential across diverse sectors. In addition to



