- Ethereum price completes the rejection from over the weekend after hitting a curb.
- ETH sinks in search of support and could have more room to go.
- The rally could remain intact if $1,425 holds its ground.
Ethereum (ETH) price sees pressure mounting as profit-taking gets sped up by bulls exiting their positions in light of the risk events into next week. With several big central banks set to issue their first monetary policy meeting for the year, traders are bracing for a cold shower as several central bankers have recently issued warnings that a victory dance in the markets is too early and too premature since inflation remains historically elevated. As long as the 200-day Simple Moving Average (SMA) at $1,425 holds, the rally is intact, while any lower break is a warning sign.
Ethereum price is still granted for a rally, but momentum is fading
Ethereum price is seeing the sentiment and enthusiasm among traders take a turn for the worse as markets signal that profit-taking is underway. The trigger came after $1,688 got tested with a firm rejection as the end result. With the current fade of roughly 10% to the downside, a cool-down in the Relative Strength Index (RSI) and its price action is welcomed, but it must not go further than needed.
ETH seems to be making a balance test to see if this rally is strong enough, has more legs to go higher, and breaks that $1,688 level to start flirting with $2,000 in the near term. Expect to see that the rally is still supported and will soon test $1,688 again to the upside with support granted near the monthly R3 at $1,512. Should that R3 level fail, the safeguard will be found at $1,425, which will act as the last line of defence for this rally, before restarting the journey toward $2,000.
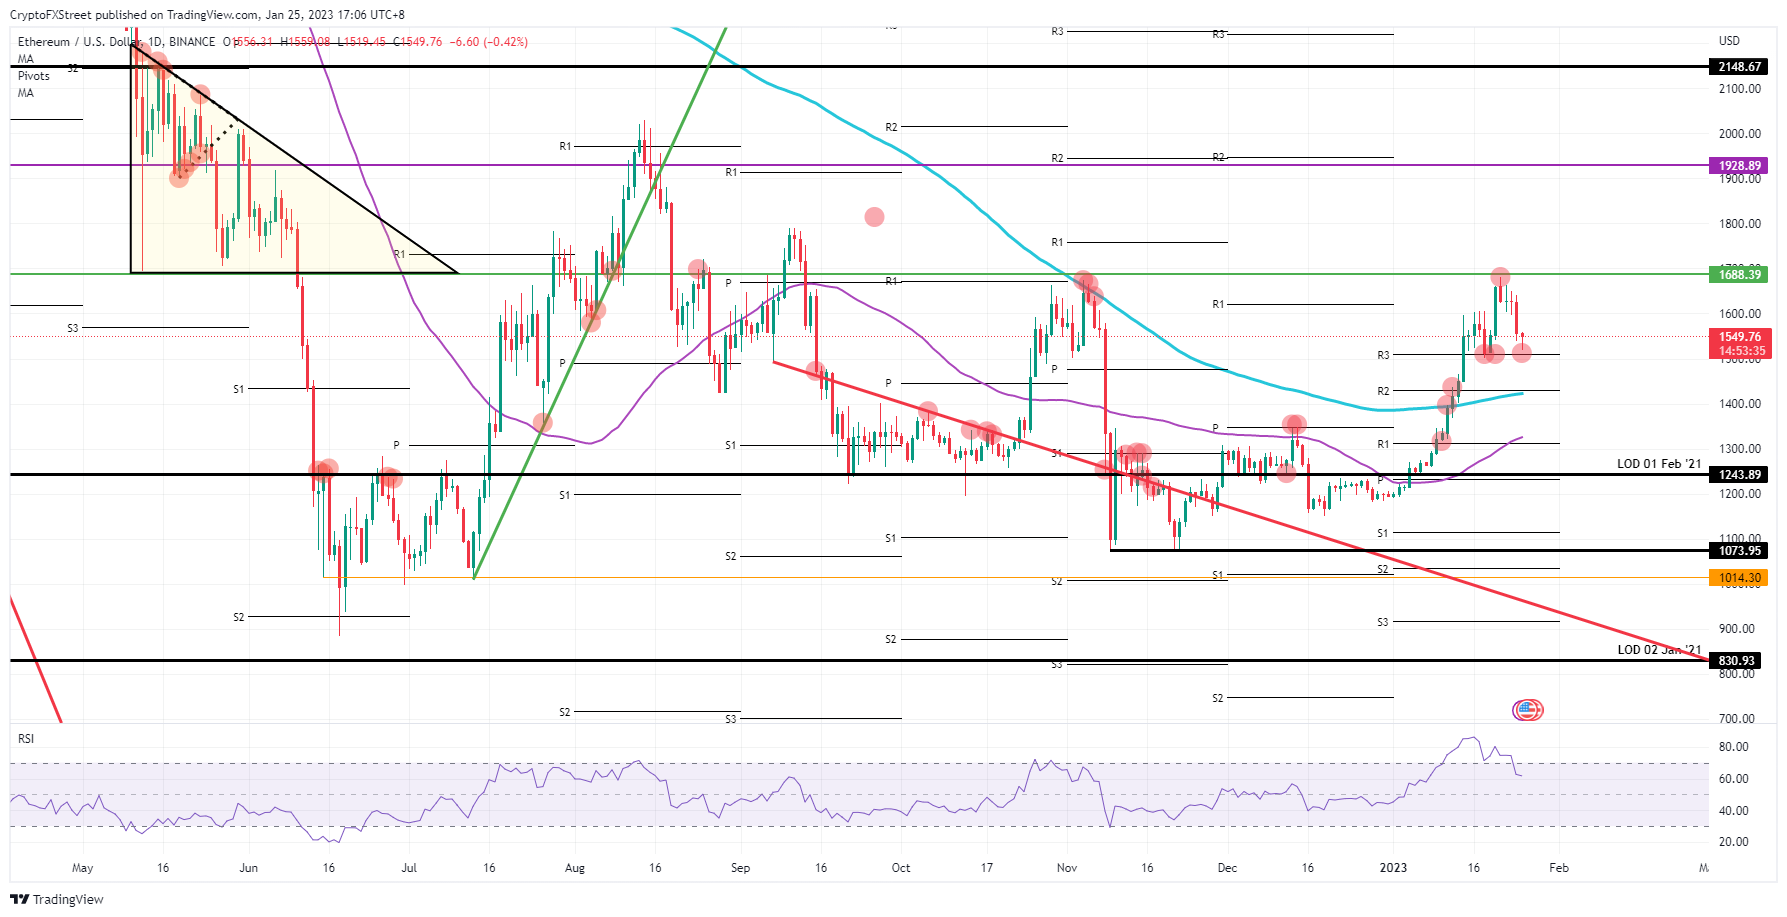
ETH/USD daily chart
Already underlined in the above paragraphs is that the balance or the fine line of this rally to be supported is very thin. Risk to the downside could easily come with price action breaking below the 200-day SMA. When that happens, expect several stops to be hit and create a wave, a flood of sell orders, creating an equilibrium between buyers and sellers. This means that price action will be driven towards the first $1,315 near the monthly R1 and the 55-day SMA, and possibly even $1,243 with a test of that pivotal level from February 1st of 2021.
Information on these pages contains forward-looking statements that involve risks and uncertainties. Markets and instruments profiled on this page are for informational purposes only and should not in any way come across as a recommendation to buy or sell in these assets. You should do your own thorough research before making any investment decisions. FXStreet does not in any way guarantee that this information is free from mistakes, errors, or material misstatements. It also does not guarantee that this information is of a timely nature. Investing in Open Markets involves a great deal of risk, including the loss of all or a portion of your investment, as well as emotional distress. All risks, losses and costs associated with investing, including total loss of principal, are your responsibility. The views and opinions expressed in this article are those of the authors and do not necessarily reflect the official policy or position of FXStreet nor its advertisers. The author will not be held responsible for information that is found at the end of links posted on this page.
If not otherwise explicitly mentioned in the body of the article, at the time of writing, the author has no position in any stock mentioned in this article and no business relationship with any company mentioned. The author has not received compensation for writing this article, other than from FXStreet.
FXStreet and the author do not provide personalized recommendations. The author makes no representations as to the accuracy, completeness, or suitability of this information. FXStreet and the author will not be liable for any errors, omissions or any losses, injuries or damages arising from this information and its display or use. Errors and omissions excepted.
The author and FXStreet are not registered investment advisors and nothing in this article is intended to be investment advice.
Recommended Content
Editors’ Picks
Here are the best and worst-performing cryptocurrencies in H1 2024

A recent report by Crypto Koryo on Wednesday revealed meme coins as the top performers among cryptocurrencies so far in 2024, with several altcoins coming in behind. The worst-performing tokens are DeFi and governance tokens.
Ethereum poised to follow Nvidia's steps as Bitwise files updated S-1 draft

Ethereum (ETH) is down 3% on Wednesday following Bitwise filing an updated S-1 draft and a wider market downturn with potential Mt. Gox BTC supply flooding the market.
What to expect from altcoins as ETH ETF approval draws closer

As the crypto market continues consolidating on Wednesday, altcoins show mixed signals ahead of the spot ETH ETF launch. Many have predicted that the alt season may not occur in this cycle following the market lull. However, two key metrics suggest otherwise.
PolitiFi meme coins surge as Biden support lowers

Crypto prediction markets favor Kamala Harris over President Joe Biden as Democratic nominee in upcoming presidential elections. Meme coins based on Vice President Harris rallied amid BODEN token's 30% decline. Other tokens based on possible replacements for Biden experienced similar surges.
Bitcoin: BTC price correction could end in July, according to seasonal data

Bitcoin (BTC) price appears poised for a decline this week, influenced by slight outflows in US spot ETFs, selling activity among BTC miners, and a combined transfer of 4,690.28 BTC to centralized exchanges by the US and German governments.