Crypto Today: Bitcoin, Ethereum, XRP tick lower amid mixed ETF flows
- Bitcoin sustains mild losses for the second straight day as $527 million in ETF inflows cushion against intense headwinds.
- Ethereum price action weighs on structural support amid $103 million in ETF outflows.
- XRP upside capped under $1.30, with the SuperTrend and short, medium and long-term moving averages limiting recovery potential.

Bitcoin (BTC) is trading above $81,000 on Tuesday, aligning with a lethargic tone in the broader cryptocurrency market. The support range between $80,000-$81,000 reinforces the prevailing stability and consolidation, prompting institutional inflows.
Altcoins, including Ethereum (ETH) and Ripple (XRP), reflect Bitcoin’s lock-step price action, trading below $2,400 and $1.30, respectively. The path of least resistance appears downward for both tokens despite select demand areas.
On the macro environment, focus remains on the Federal Reserve’s (Fed) October 28 monetary decision. CME Group’s FedWatch Tool shows market participants currently pricing in a high probability of the Fed holding rates in the 3.75-4.00% range despite elevated inflation in the United States (US).
Bitcoin ETFs attract fresh inflows
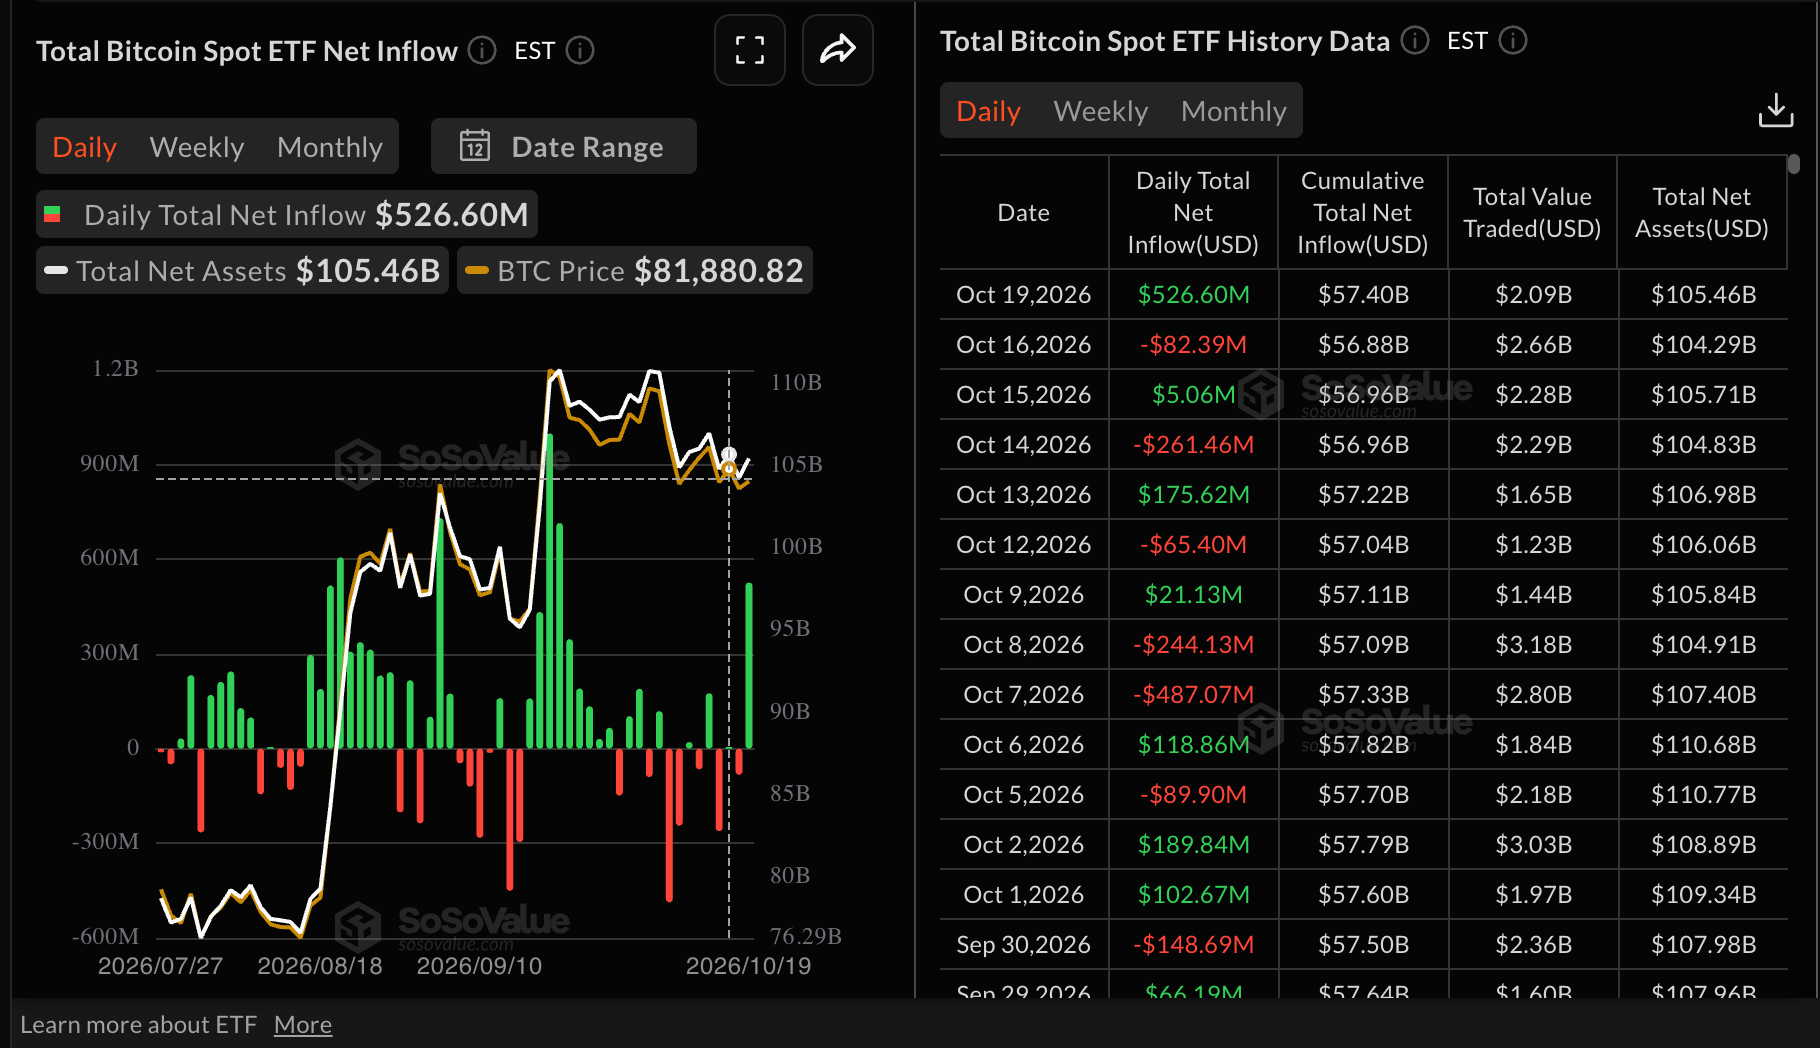
Institutional investors staged a comeback on Monday, with $527 million in Bitcoin spot Exchange-Traded Funds (ETFs), up from roughly $82 million in outflows last Friday. Broadly, cumulative inflows stand at $57.4 billion, with net assets under management at $105 billion, according to SoSoValue data. A steady inflow pattern would cushion Bitcoin against headwinds, increasing the odds of a recovery.
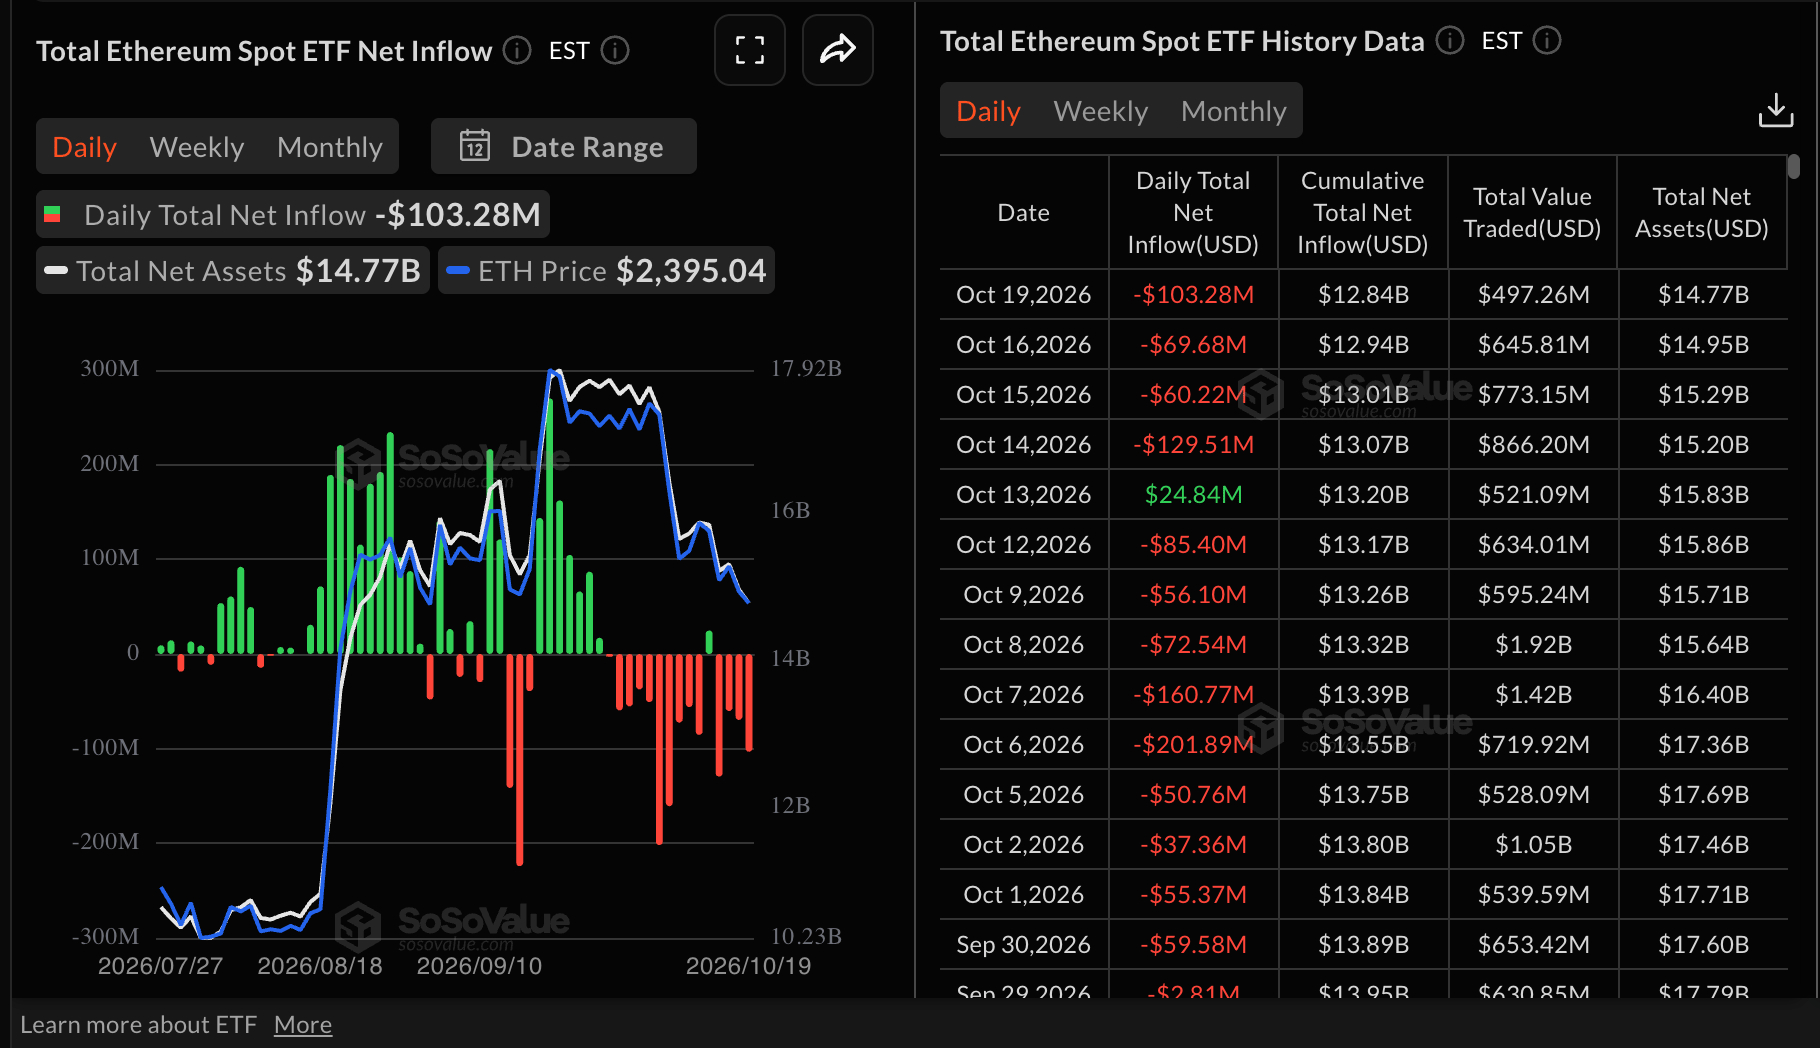
Ethereum spot ETFs, on the other hand, recorded $103 million in outflows on Monday, sustaining a four-day bearish streak. Looking back, since September 29, ETH ETFs have posted only one day of inflows, totaling $25 million on October 13.
Quoc Dat Tong, senior financial market strategist at Exness, says that the latest ETH spot ETFs "do not tell us why every investor sold. Some may be taking profits, while others may be reducing how much money they have in cryptocurrencies. The funds also represent only part of the ether market." "Even so, continued withdrawals suggest that this source of demand remains weaker than it was during the strong buying seen in late September," he adds.
Meanwhile, cumulative inflows remain positive at $12.8 billion, while net assets average $15 billion.
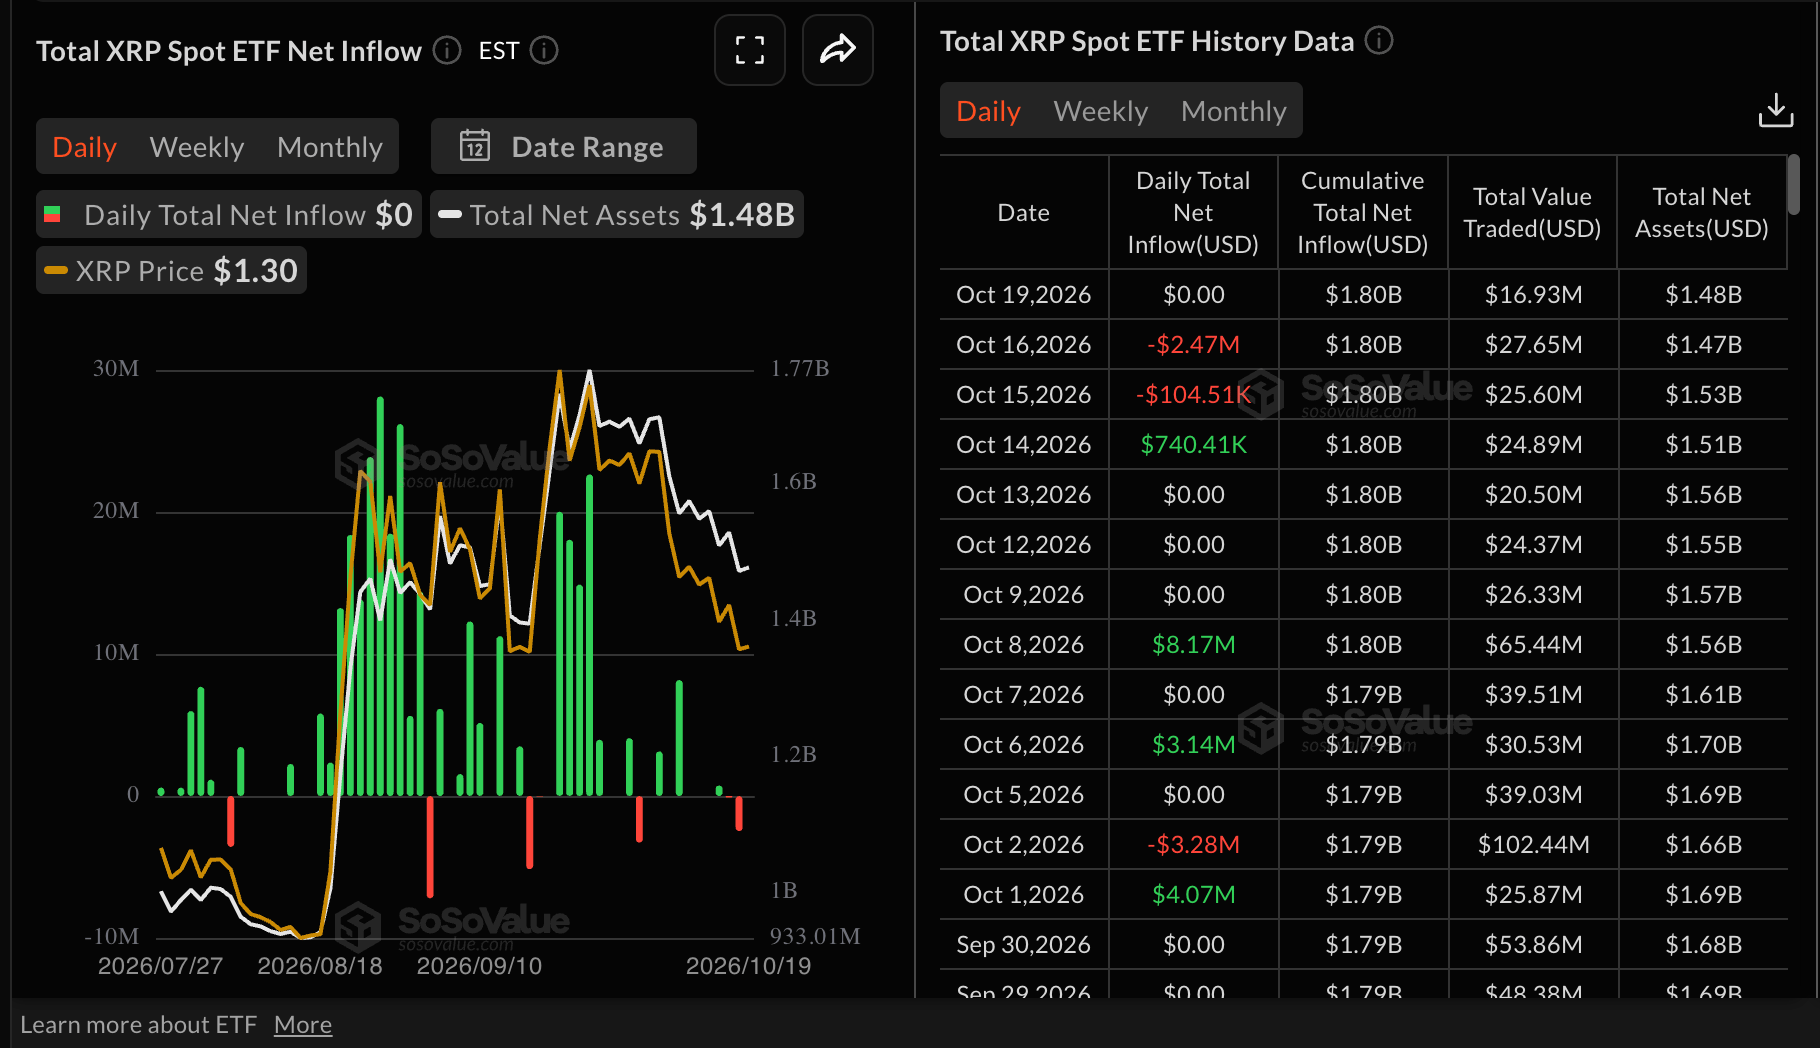
As for XRP spot ETFs, after two days of outflows, $105,000 last Thursday and $2.5 million on Friday, activity remained muted on Monday. Still, the long-term outlook is broadly positive, with cumulative inflows of $1.8 billion and net assets of $1.5 billion.
Technical analysis: Bitcoin bulls uphold key support range
Bitcoin trades at $81,461, extending its recovery above a dense floor of medium- and long-term Exponential Moving Averages (EMAs). The pair holds above the 50-day EMA at $80,620 and the 100-day EMA at $77,194, while the 200-day EMA at $76,032 reinforces the broader bullish structure.
The SuperTrend line at $79,664 also sits beneath spot, suggesting downside spikes are being absorbed, although the Moving Average Convergence Divergence (MACD) reading below zero and a Relative Strength Index (RSI) around 46 hint at only moderate bullish momentum rather than a strong trend.
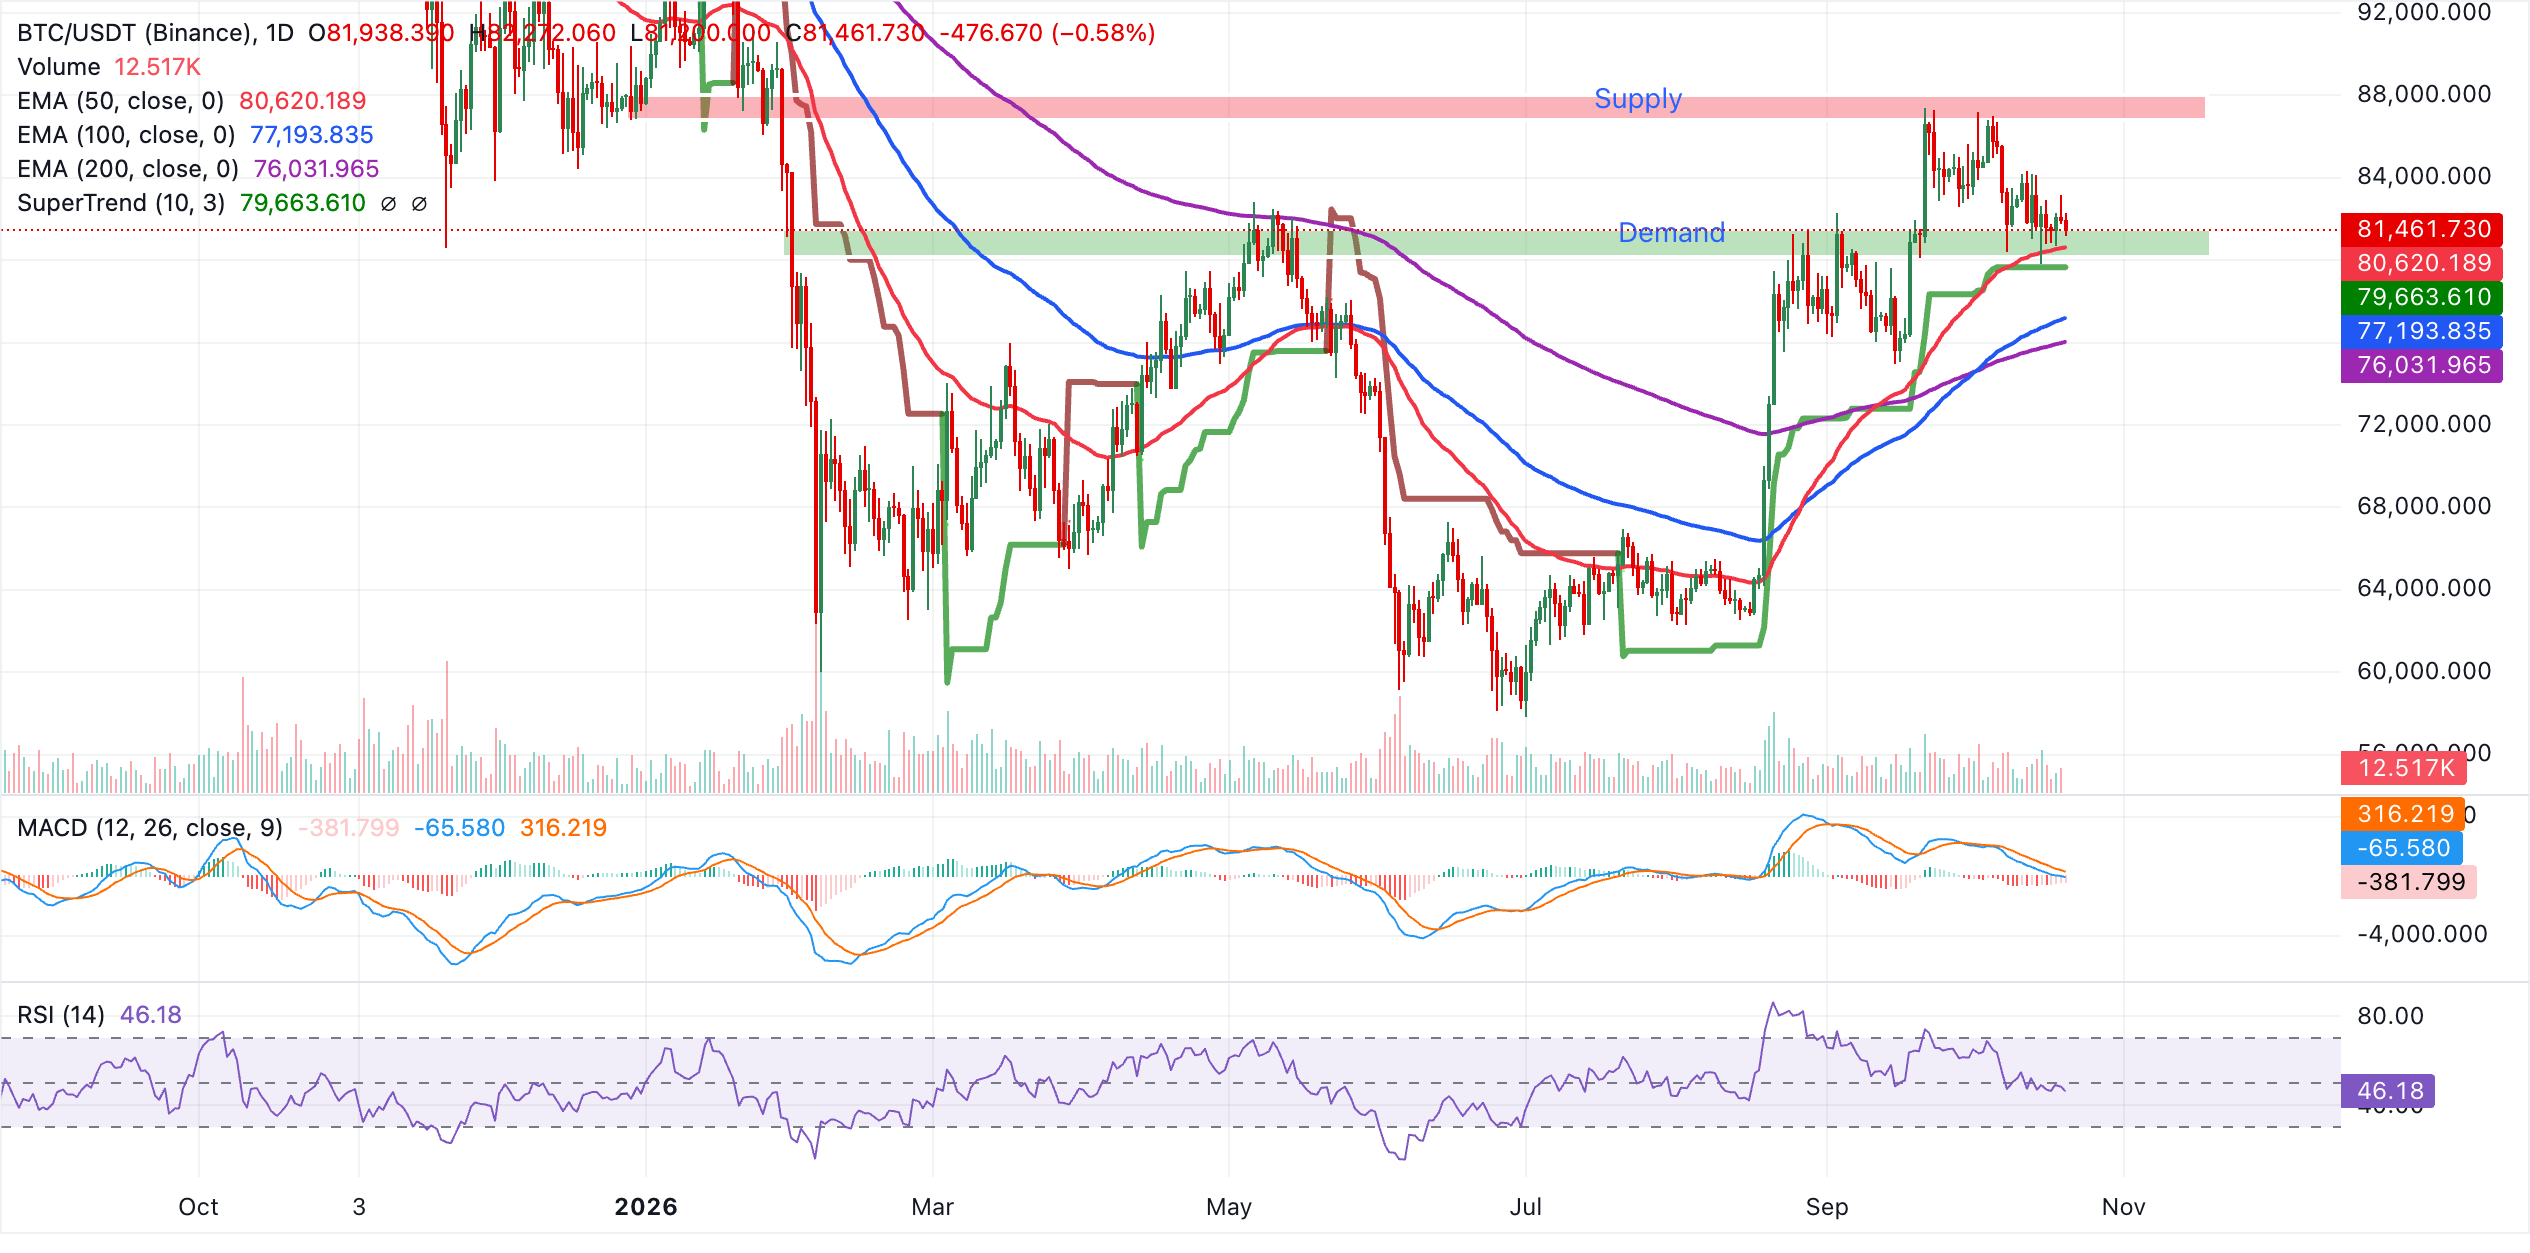
Initial support is seen at the SuperTrend barrier near $79,664, ahead of deeper structural demand clustered around the 200-day EMA at $76,032. As long as BTC holds above these levels on a closing basis, the bias favors further consolidation with upside attempts, even if momentum indicators suggest a gradual rather than impulsive advance.
Altcoins technical analysis: Ethereum and XRP face renewed pressure
Ethereum trades at $2,390, retaining a bearish near-term bias as price holds below the 50-day EMA at $2,480 while remaining above the 100-day EMA at $2,360 and the 200-day EMA at $2,315. This setup suggests a corrective phase within a broader uptrend, with downside pressure reinforced by a negative MACD reading and a subdued RSI near 36, indicating lingering selling interest but not yet extreme oversold conditions.
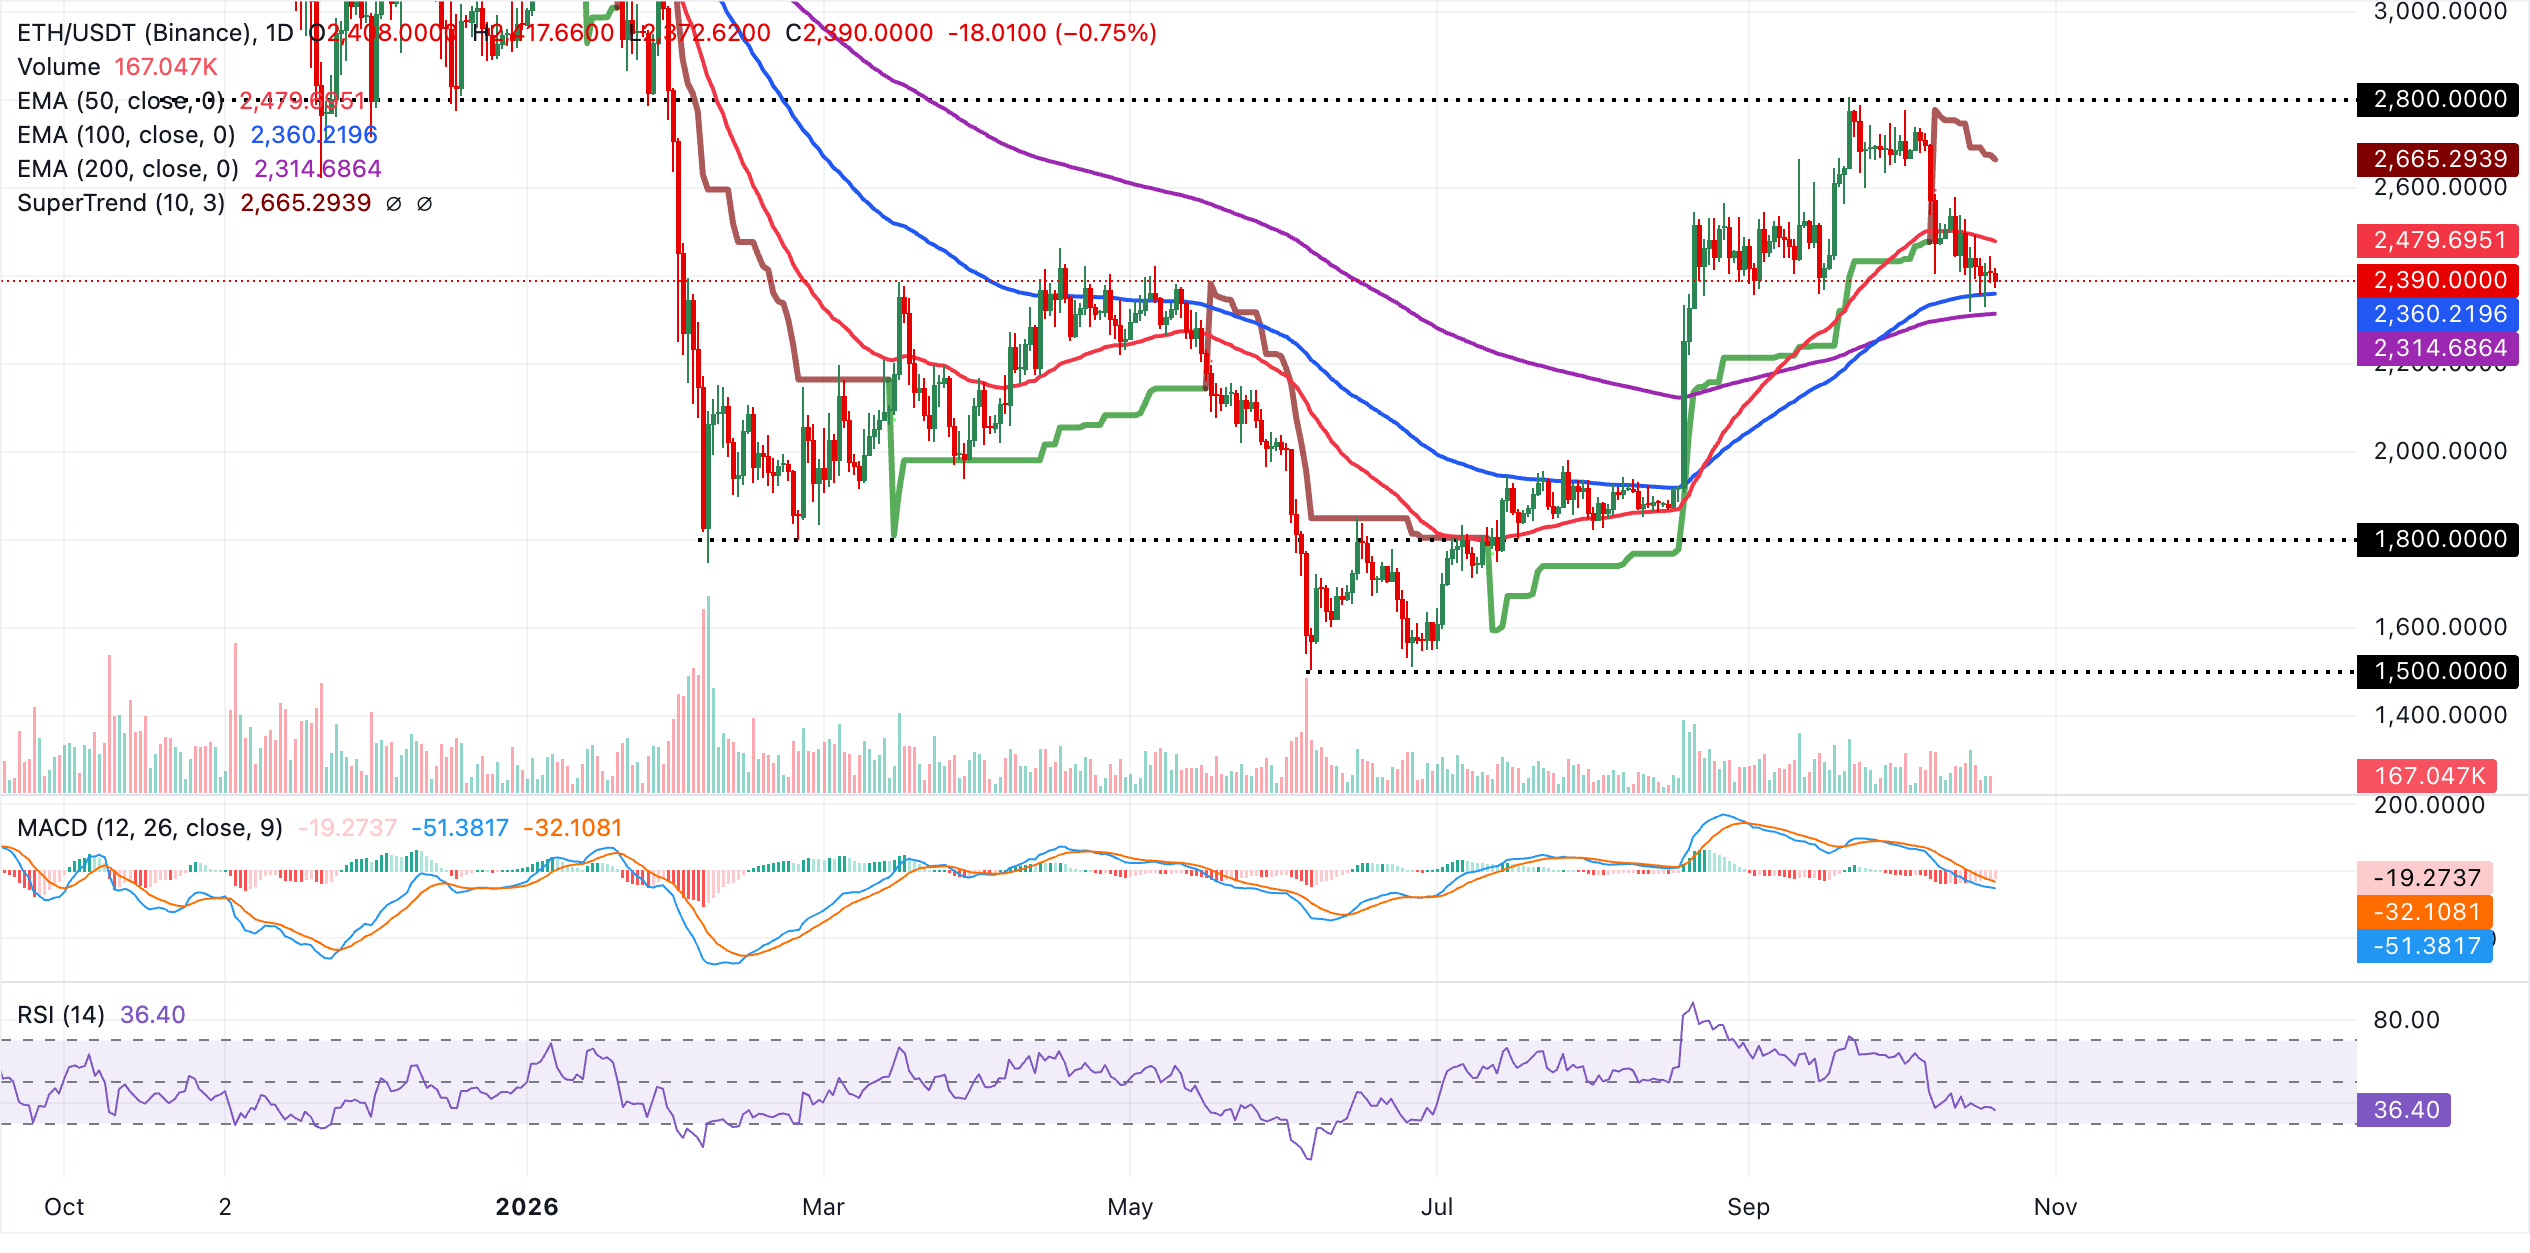
Initial resistance lies at the 50-day EMA at $2,480, and a daily close above this barrier would be needed to ease the current bearish tone and reopen the path toward higher levels. On the downside, immediate support emerges from the SuperTrend line at $2,665, while closer structural demand is provided by the 100-day EMA at $2,360 and then the 200-day EMA at $2,314.69. A break below these moving averages would likely deepen the corrective move and expose ETH to a more pronounced bearish extension.
XRP, meanwhile, trades near $1.30, below all key moving averages and the active SuperTrend line, keeping the near-term bias bearish. Price remains under the 100-day EMA at $1.34, as well as the 50-day and 200-day EMAs clustered around $1.38, suggesting the broader uptrend structure is under pressure.
Momentum indicators reinforce this tone, with the MACD below zero and its recent readings negative, while the RSI at 35 hovers just above oversold territory, hinting that selling pressure dominates but is approaching a zone where stabilization or a corrective bounce could emerge.
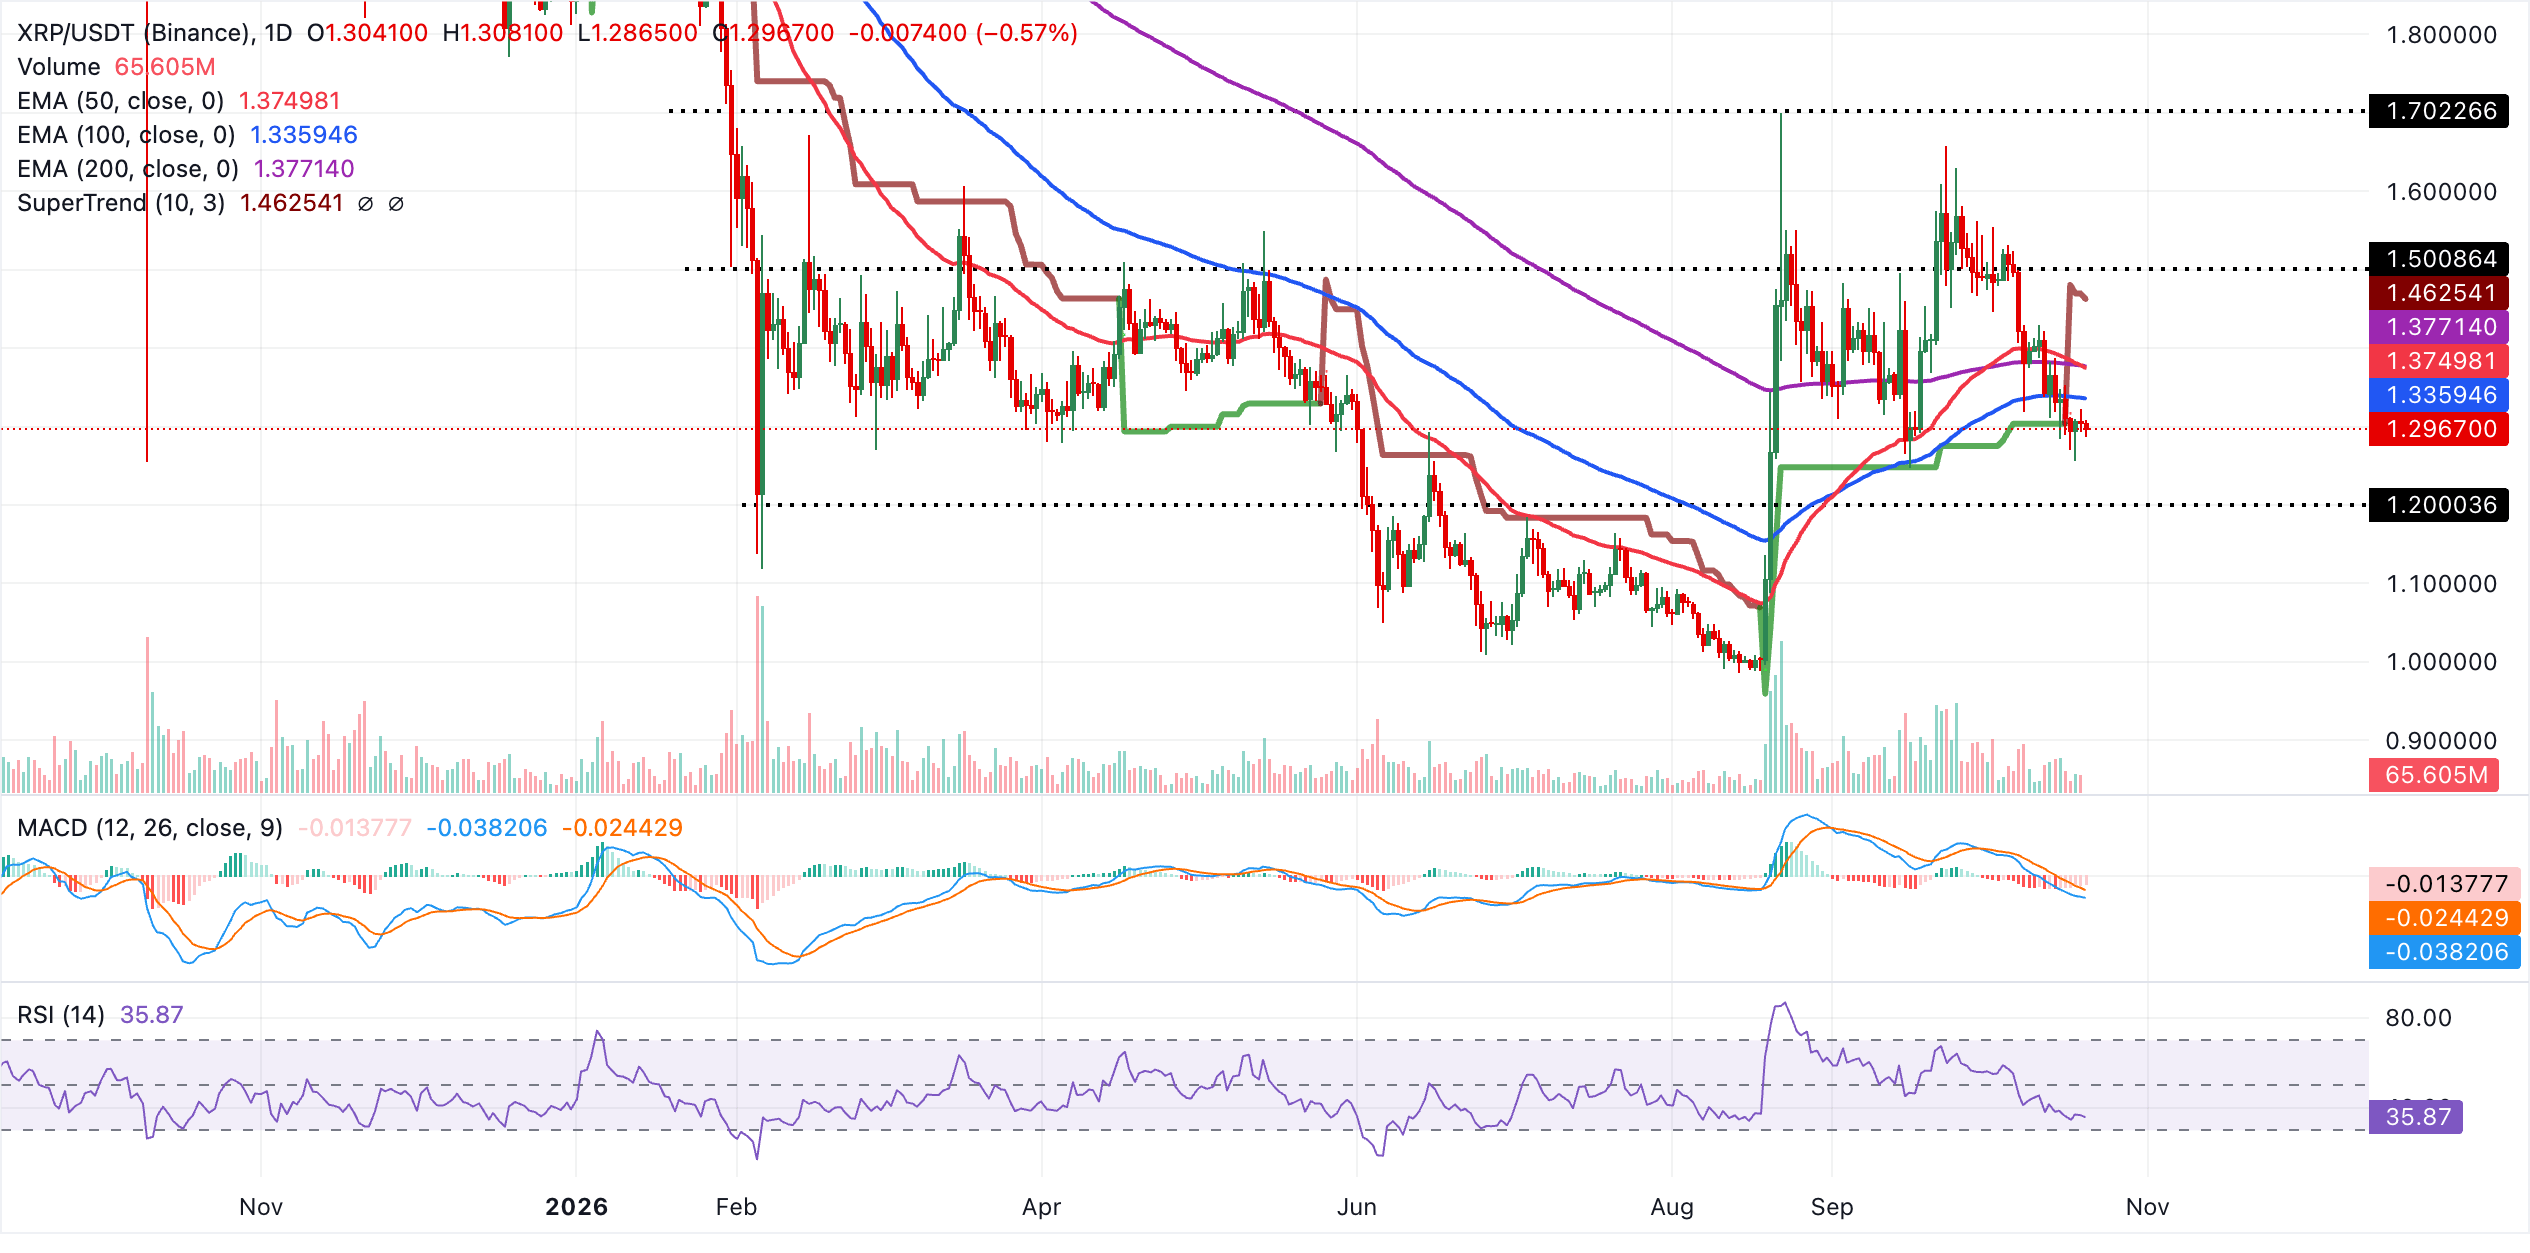
Initial resistance lies at the 100-day EMA at $1.34, and a daily close above this level would be needed to ease immediate downside pressure. Above there, a denser barrier is formed by the 50-day EMA at $1.38, where any recovery could stall before the broader bearish structure is challenged.
Further up, the SuperTrend line at $1.46 marks a more significant bullish trigger. Only a decisive break above this level would suggest that XRP has turned the corner from its current corrective phase. With no clear nearby support levels from the existing indicators on the daily chart, the downside remains exposed until new demand emerges.
(The technical analysis of this story was written with the help of an AI tool. Know more.)
Crypto ETF FAQs
An Exchange-Traded Fund (ETF) is an investment vehicle or an index that tracks the price of an underlying asset. ETFs can not only track a single asset, but a group of assets and sectors. For example, a Bitcoin ETF tracks Bitcoin’s price. ETF is a tool used by investors to gain exposure to a certain asset.
Yes. The first Bitcoin futures ETF in the US was approved by the US Securities & Exchange Commission in October 2021. A total of seven Bitcoin futures ETFs have been approved, with more than 20 still waiting for the regulator’s permission. The SEC says that the cryptocurrency industry is new and subject to manipulation, which is why it has been delaying crypto-related futures ETFs for the last few years.
Yes. The SEC approved in January 2024 the listing and trading of several Bitcoin spot Exchange-Traded Funds, opening the door to institutional capital and mainstream investors to trade the main crypto currency. The decision was hailed by the industry as a game changer.
The main advantage of crypto ETFs is the possibility of gaining exposure to a cryptocurrency without ownership, reducing the risk and cost of holding the asset. Other pros are a lower learning curve and higher security for investors since ETFs take charge of securing the underlying asset holdings. As for the main drawbacks, the main one is that as an investor you can’t have direct ownership of the asset, or, as they say in crypto, “not your keys, not your coins.” Other disadvantages are higher costs associated with holding crypto since ETFs charge fees for active management. Finally, even though investing in ETFs reduces the risk of holding an asset, price swings in the underlying cryptocurrency are likely to be reflected in the investment vehicle too.
Author

John Isige
FXStreet
John Isige is a seasoned cryptocurrency journalist and markets analyst committed to delivering high-quality, actionable insights tailored to traders, investors, and crypto enthusiasts. He enjoys deep dives into emerging Web3 tren