Crypto Overview: Bitcoin loses $77,000, triggering $600 million in liquidations – QNT, BCH lead decline
- Bitcoin slips below $77,000 on Monday, extending a steady four-day decline.
- Crypto longs have liquidated over $500 million in 24 hours, signaling a sell-side dominance.
- Quant and Bitcoin Cash are leading the decline over the last 24 hours.

Bitcoin (BTC) is trading below $77,000 at press time on Monday, extending a four-day decline for a bearish start to the week. The freefall in King Crypto triggered liquidations of over $500 million in long positions in 24 hours, inducing fear in investor sentiment. Meanwhile, the altcoins Quant (QNT) and Bitcoin Cash (BCH) are leading the decline over the last 24 hours, approaching key support levels.
Bearish grip tightens as crypto long liquidations exceed $550 million
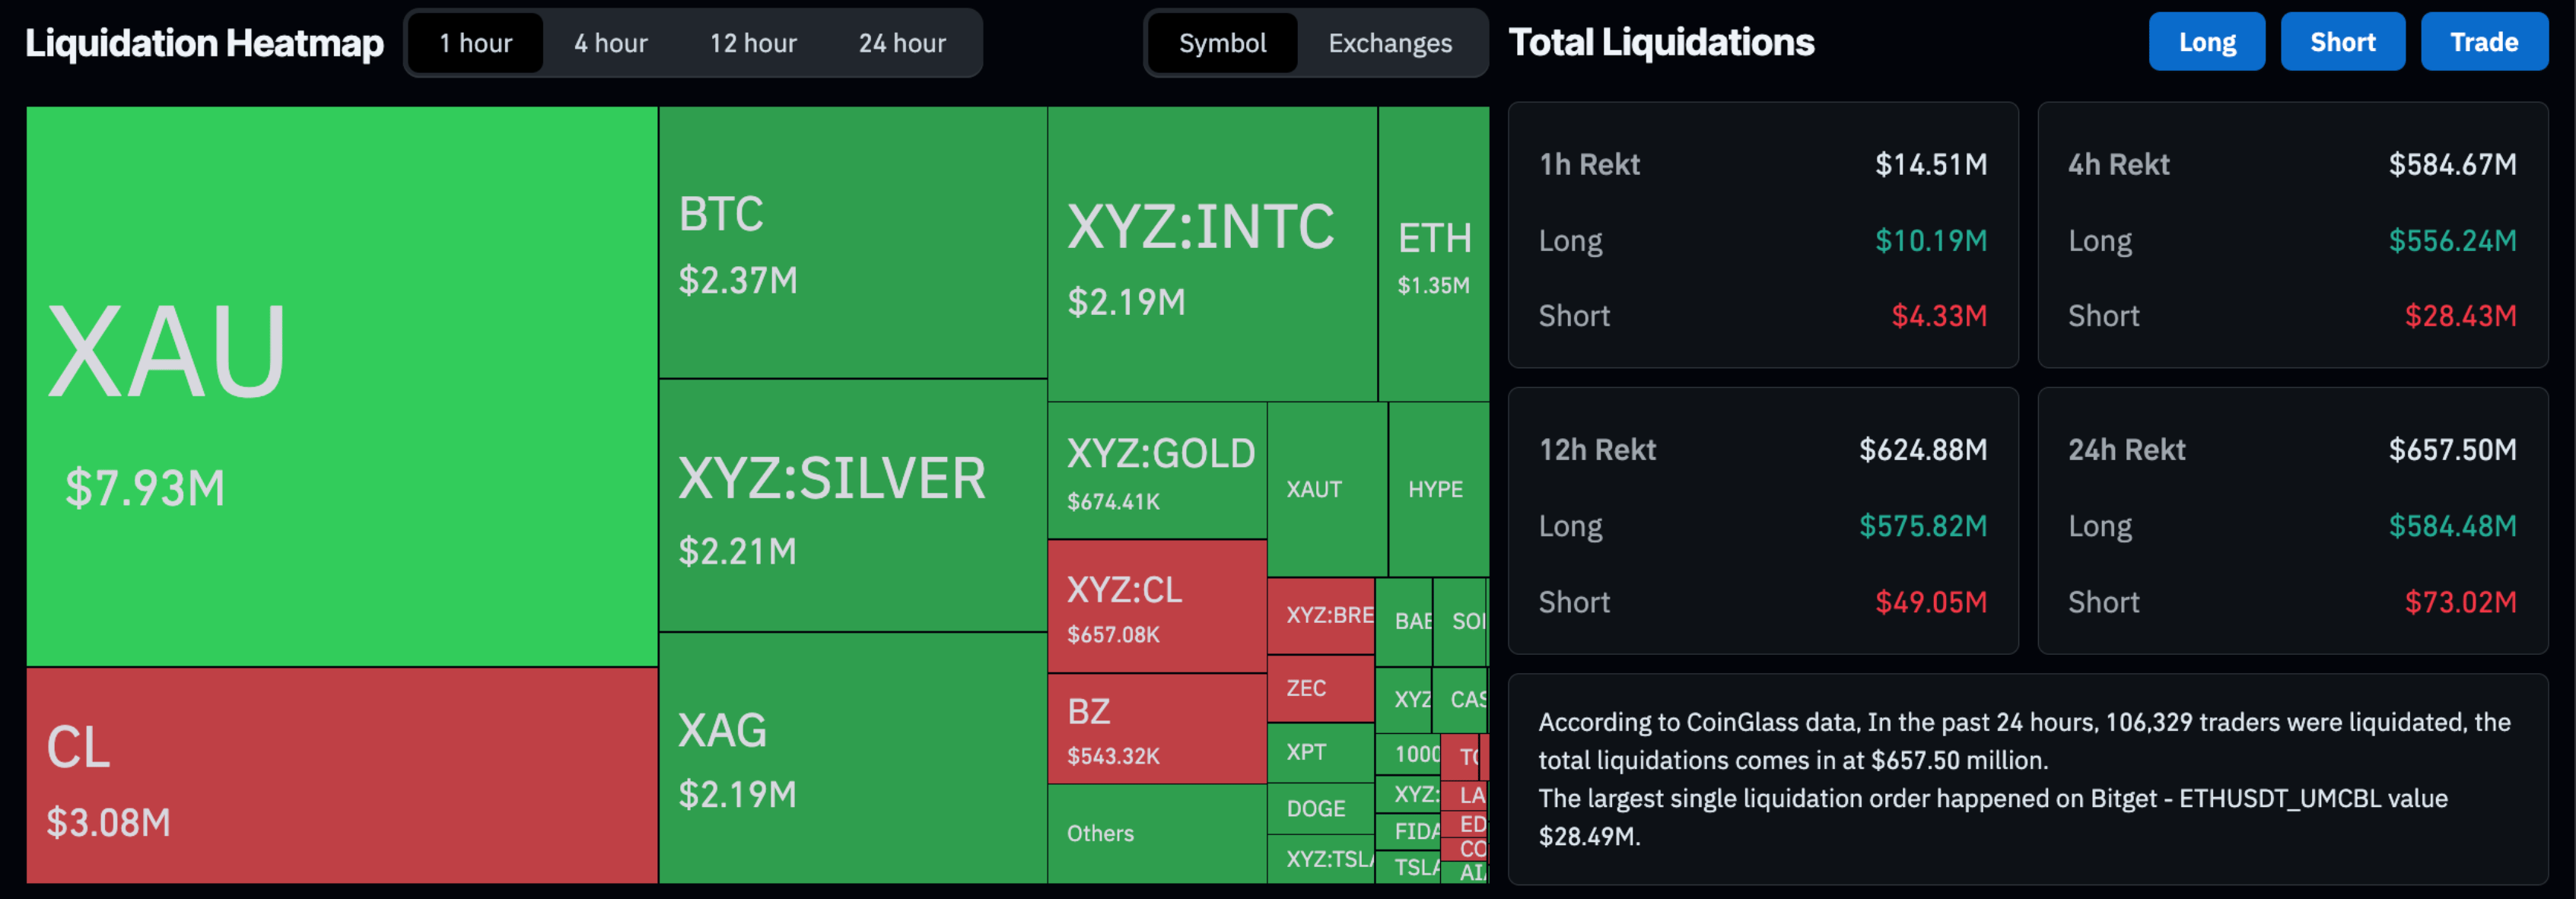
Bitcoin extends losses for the fourth straight day after the CLARITY Act gains on Thursday, as the Senate Banking Committee advanced it for a final full-Senate vote. The sell-off phase has resulted in over $657 million in total liquidations, led by $584 million in long liquidations, indicating a clear, intense wipeout of bullish positions.
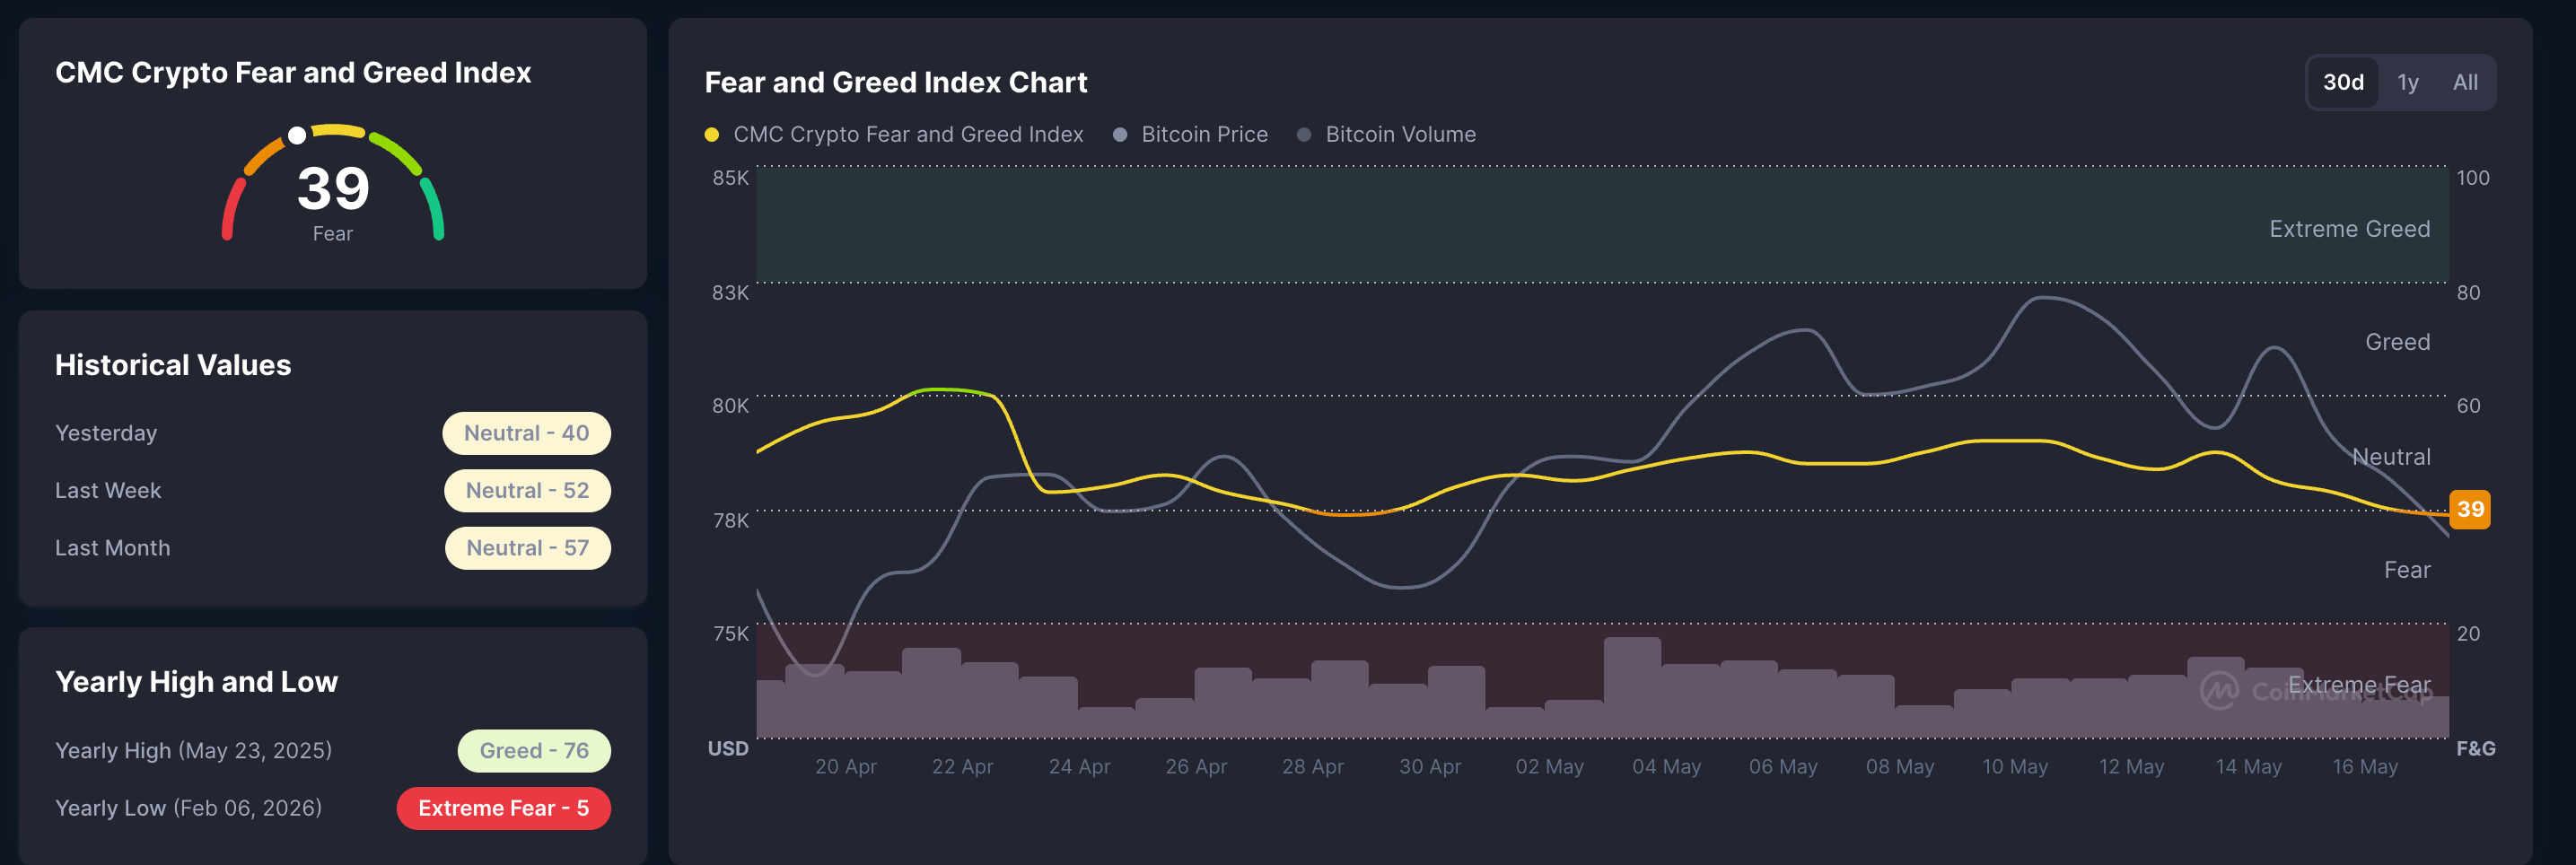
The crypto market sentiment is deteriorating as Bitcoin enters a freefall. CoinMarketCap’s Fear and Greed Index, at 39 on Monday, slipped into the fear region, down from 50 on Thursday, signaling renewed risk-off sentiment.
Bitcoin outlook: Will Bitcoin hold above $75,000?
Bitcoin hovers above $76,000 on Monday, keeping a corrective near-term bias as it tests the 50-day Exponential Moving Average (EMA) at $76,716. Still, BTC price trades comfortably above the rising trendline support zone projected from the $70,636 area. However, the broader advance looks capped in the medium term, with the 200-day EMA at $83,513 acting as the next major overhead barrier.
The Moving Average Convergence Divergence (MACD) indicator shows expanding negative histogram bars as the average lines fall after a crossover on Tuesday. Meanwhile, the Relative Strength Index (RSI) at 44 confirms that upside momentum is waning even as price remains technically supported.
On the downside, initial demand is seen at the 50-day EMA near $76,716, where a daily close below would expose a deeper pullback toward the previous retest of the 50-day EMA on April 12, at $70,740.
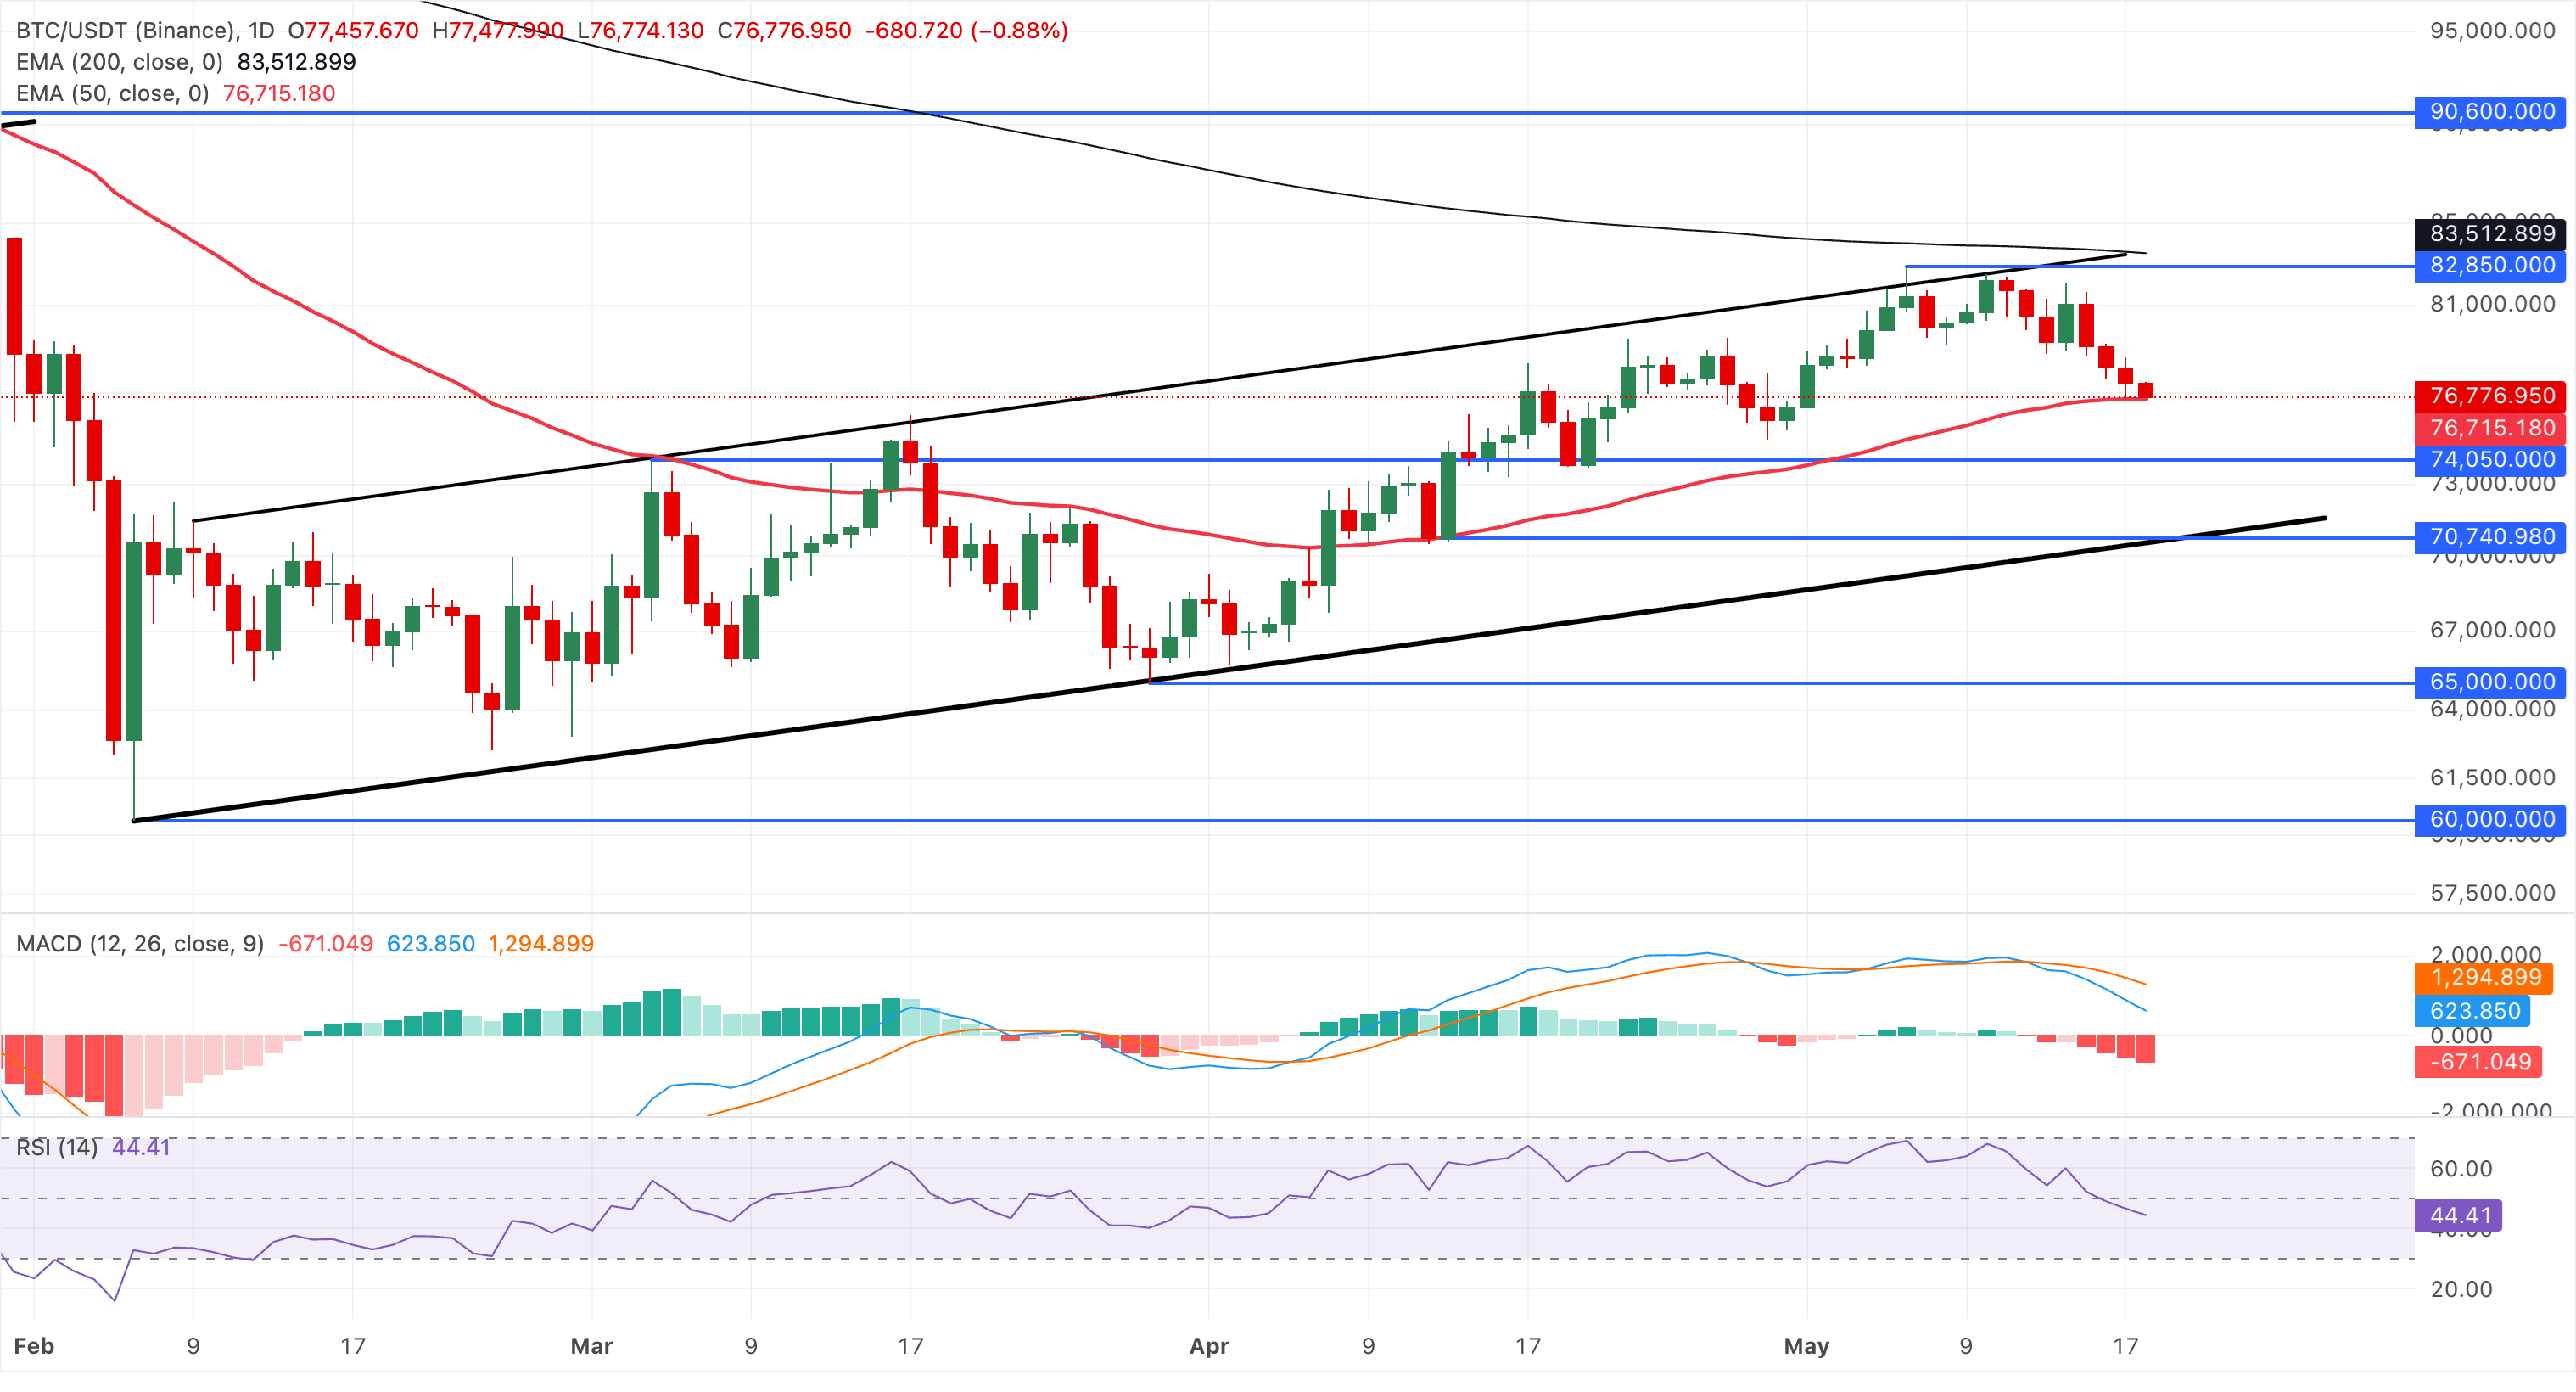
On the topside, bulls would need a rebound leading to a sustained break above the 200-day EMA at $83,513 to reopen the path toward fresh highs. Until then, the King Crypto is likely to consolidate with a slight bullish bias as long as it defends the 50-day EMA.
Bearish pressure builds over Quant and Bitcoin Cash
Quant is down to roughly $75 at press time on Monday after a 7% drop the previous day nullified the triangle pattern breakout. QNT approaches the 50-day EMA at $72.86, which serves as the immediate support level.
The MACD and signal line remain in positive territory, but the contracting histogram bars suggest reduced buying pressure, while the RSI at 53, down from the overbought zone boundary, reaffirms the correction after overextended upside pressure.
A decisive close below $72.86 could test the 50% retracement level at $68.79, measured over the downswing from $88.30 to $53.60.
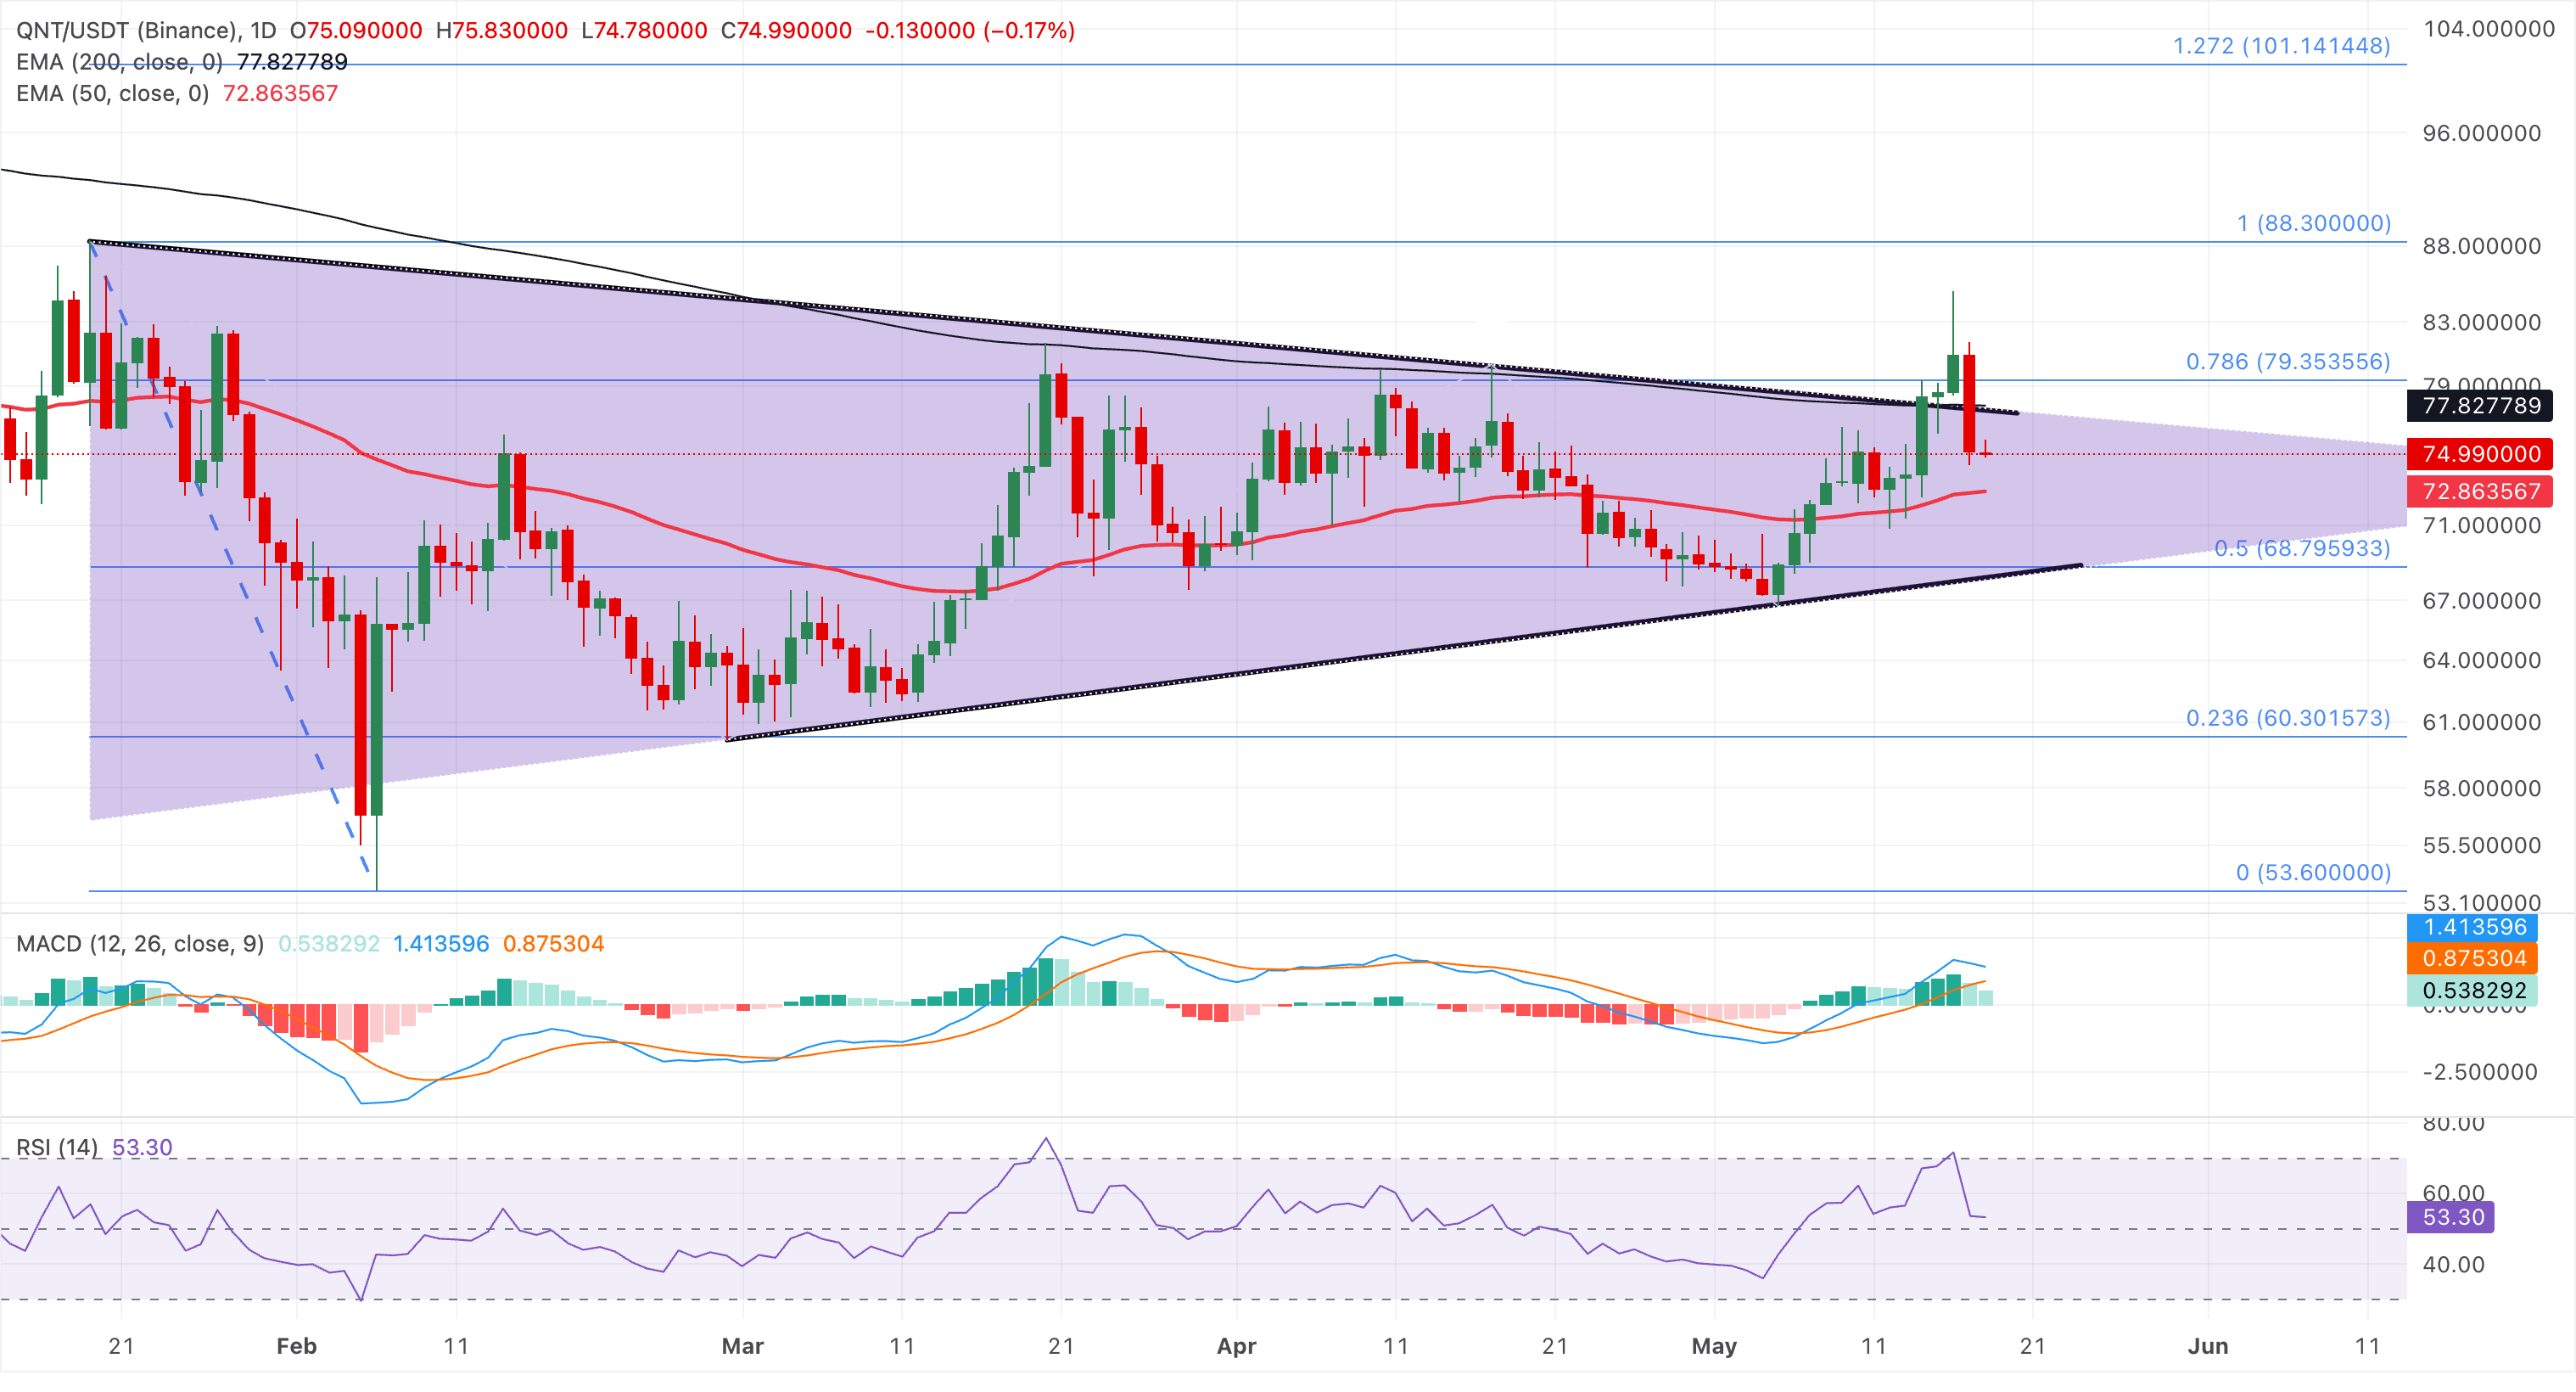
A potential rebound from the 50-day EMA at $72.86 could retest the 78.6% Fibonacci retracement level at $79.35.
Bitcoin Cash trades below $400 on Monday, extending a bearish phase after slipping decisively below recent range floors. BCH is entrenched beneath both the 50-day EMA at roughly $447 and the 200-day EMA near $490, which together reinforce a capped, downside-biased structure.
Momentum remains weak, with the MACD and signal line extending below the zero line, prompting negative histogram bars and a bearish profile that hints sellers still dominate, even as the RSI at 28 hovers in oversold territory, warning that downside could become increasingly stretched.
The S2 Pivot Point at $390 serves as the crucial support, guarding the S3 Pivot Point at $361.
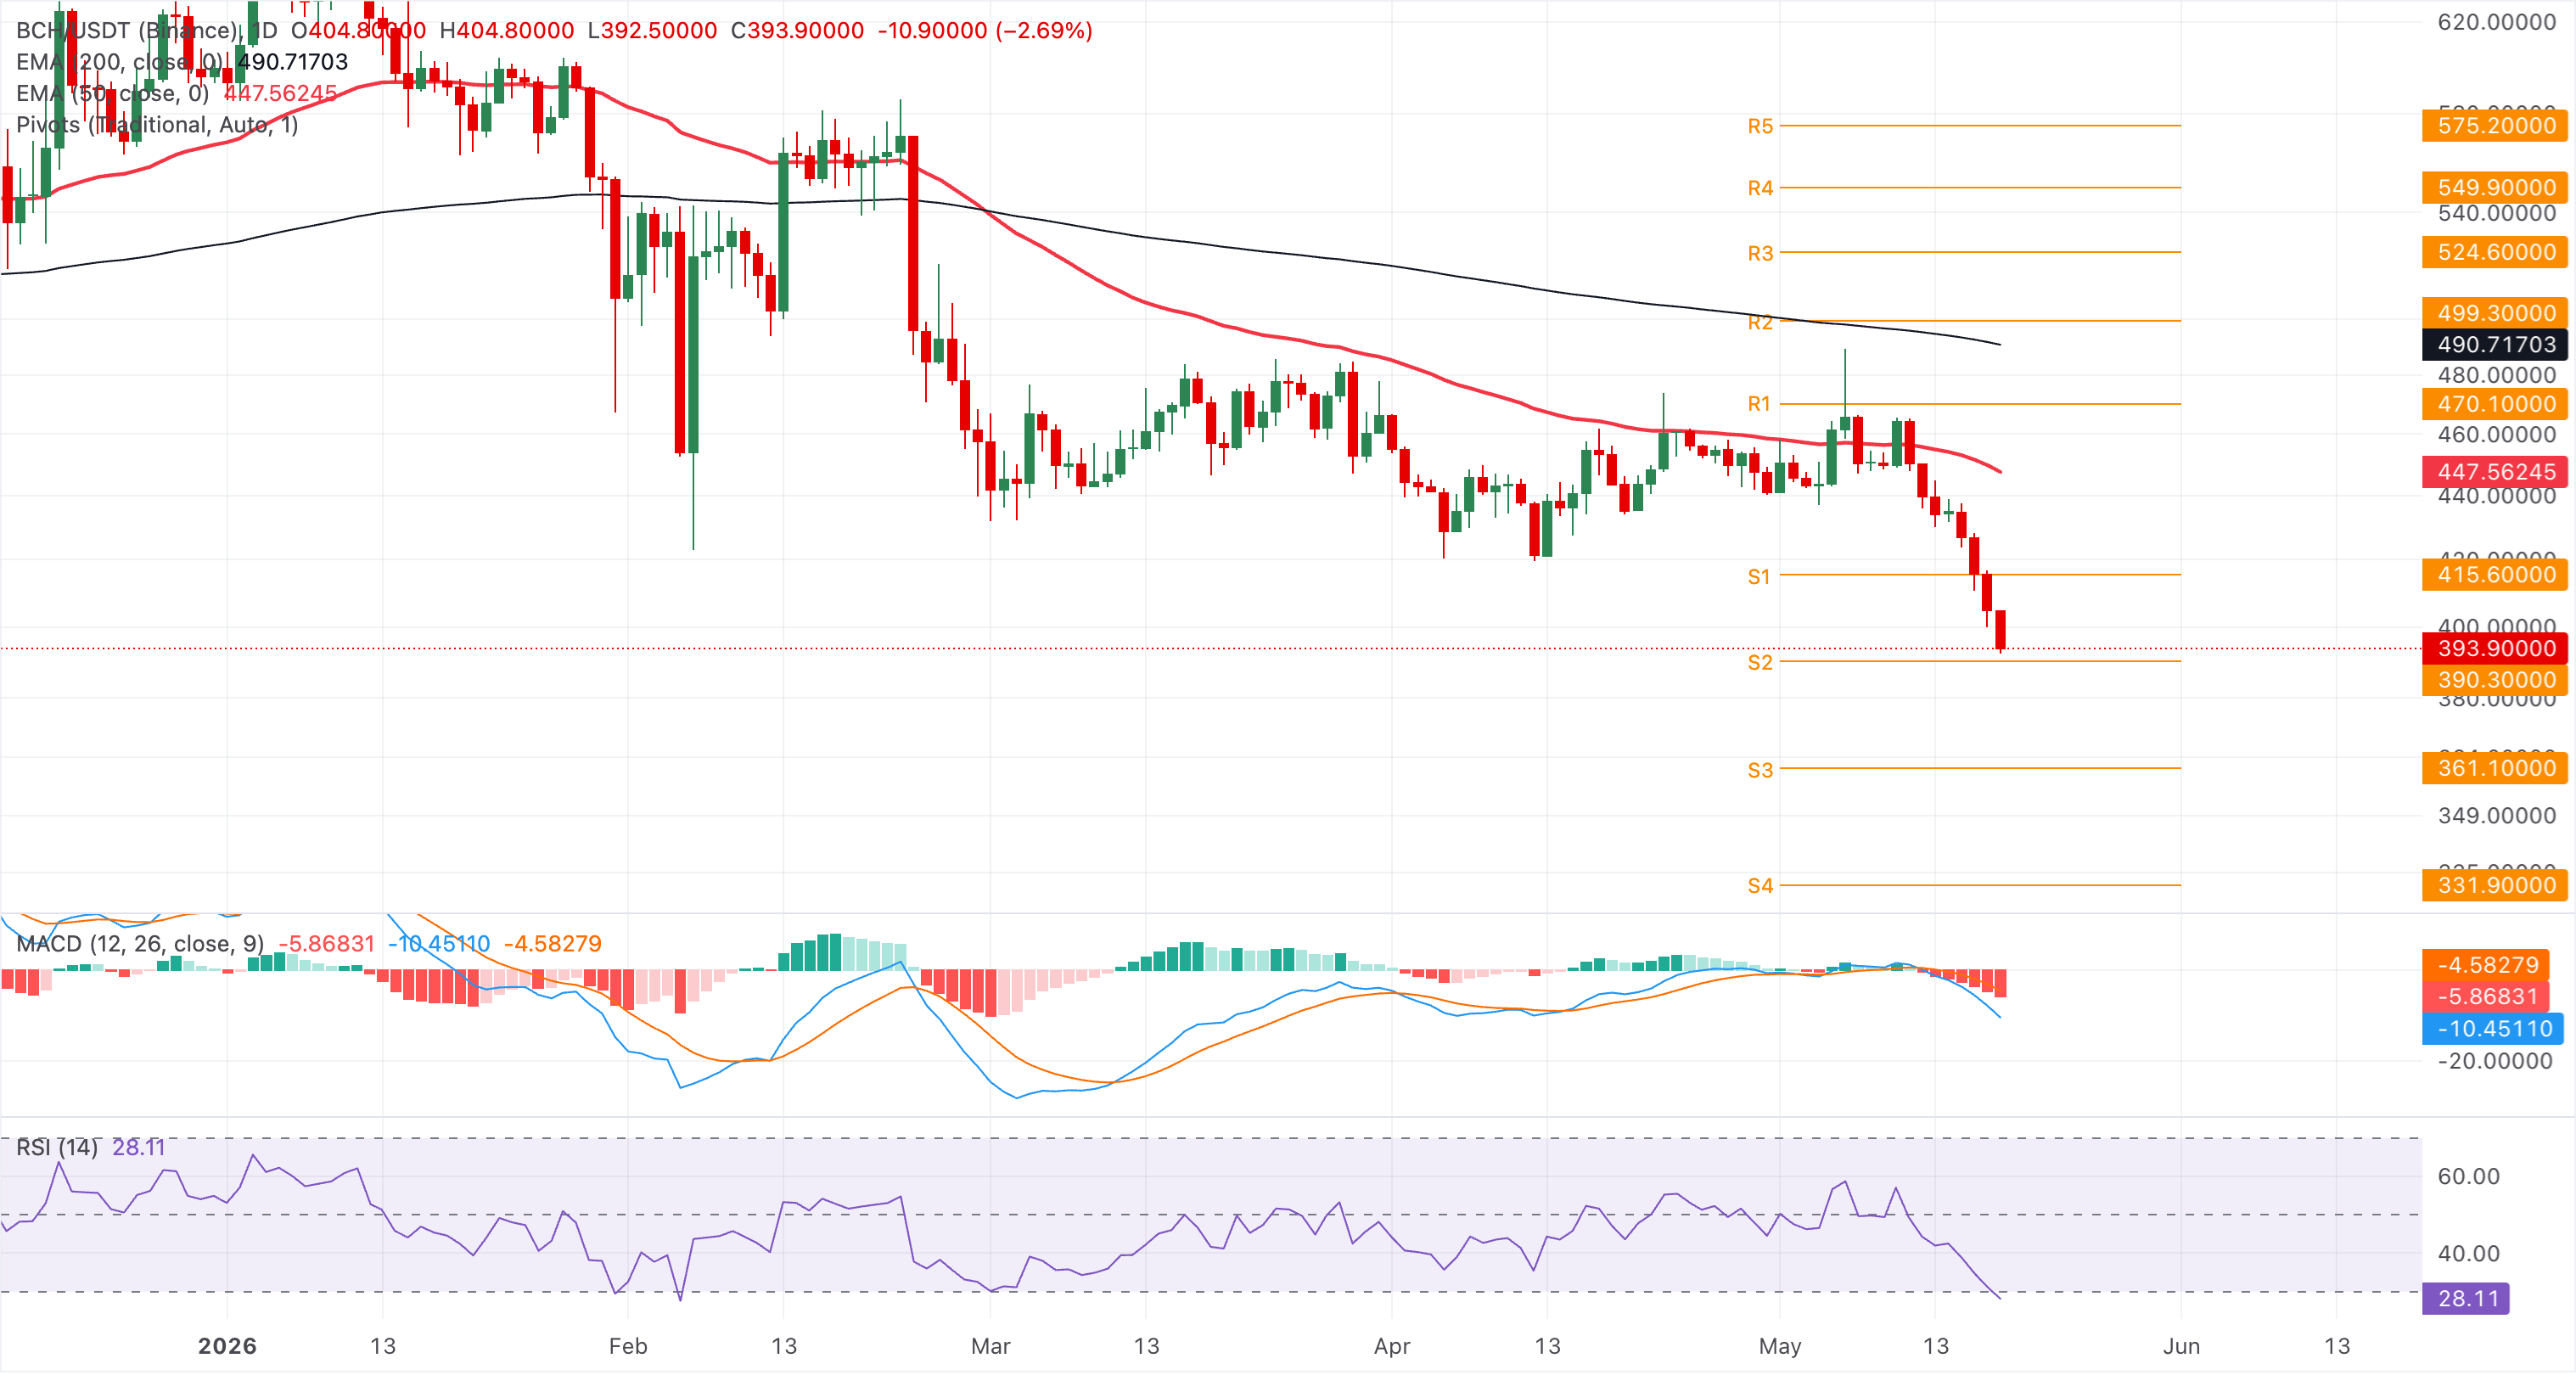
Looking up, if BCH resurfaces above $400, the S1 Pivot Point at $415 could act as support-turned-resistance, capping the upside toward the 50-day EMA at $447.
(The technical analysis of this story was written with the help of an AI tool.)
Author

Vishal Dixit
FXStreet
Vishal Dixit holds a B.Sc. in Chemistry from Wilson College but found his true calling in the world of crypto.