![]() Lorenzo Stroe
Lorenzo Stroe
Independent Analyst
- Bitcoin price seems to be overextended after a massive rally to $14,000.
- Several on-chain metrics and indicators suggest that the flagship cryptocurrency is poised for a correction.
Bitcoin is trading at $13,857 after hitting a low of $13,512 in the past 24 hours. It seems that the uncertainty around the US presidential election is not stopping the digital asset from climbing towards $14,000. While it remains unclear whether President Donald Trump or former vice president Joe Biden will win, several technical and on-chain metrics suggest that BTC is facing intense selling pressure.
Bitcoin Price Prediction: The full analysis
As uncertainty continues to reign the cryptocurrency market, Bitcoin is showing several bearish signals on its 1-day chart.
For instance, TD Sequential indicator is currently on a green nine candlestick, forecasting a one to four daily candlesticks correction. The RSI also sits in overbought territory and the SAR points recently moved on top of BTC's price, which is a very negative sign.
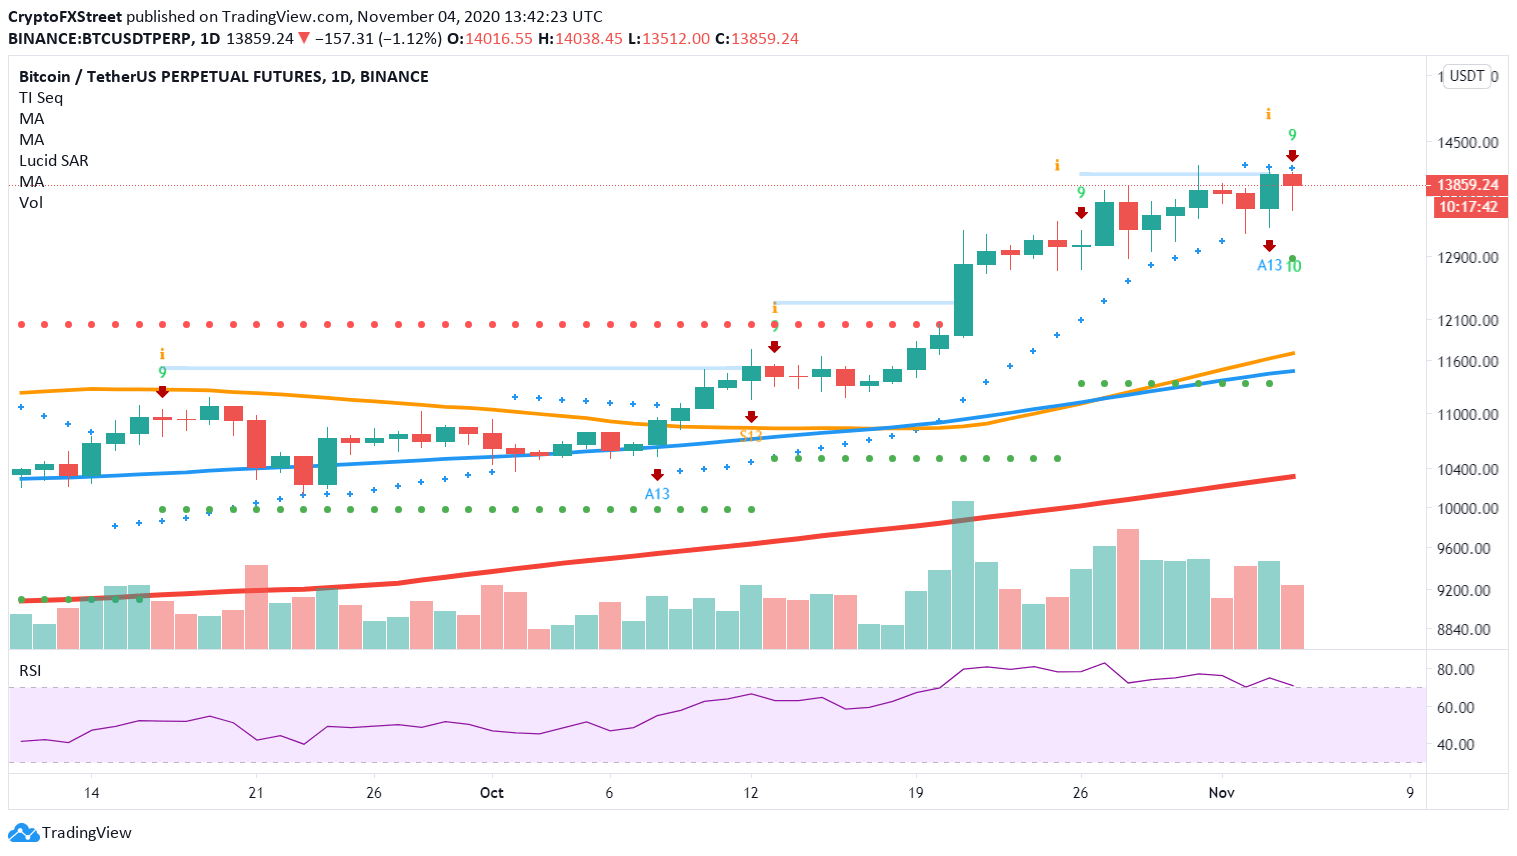
BTC/USD daily chart
Additionally, the number of BTC being sent to exchanges can be considered one of the most concerning on-chain metrics because it indicates that selling pressure is building up. The blockchain analytics company CryptoQuant recorded a significant increase in Bitcoin's exchange inflow, suggesting that investors are preparing to sell.
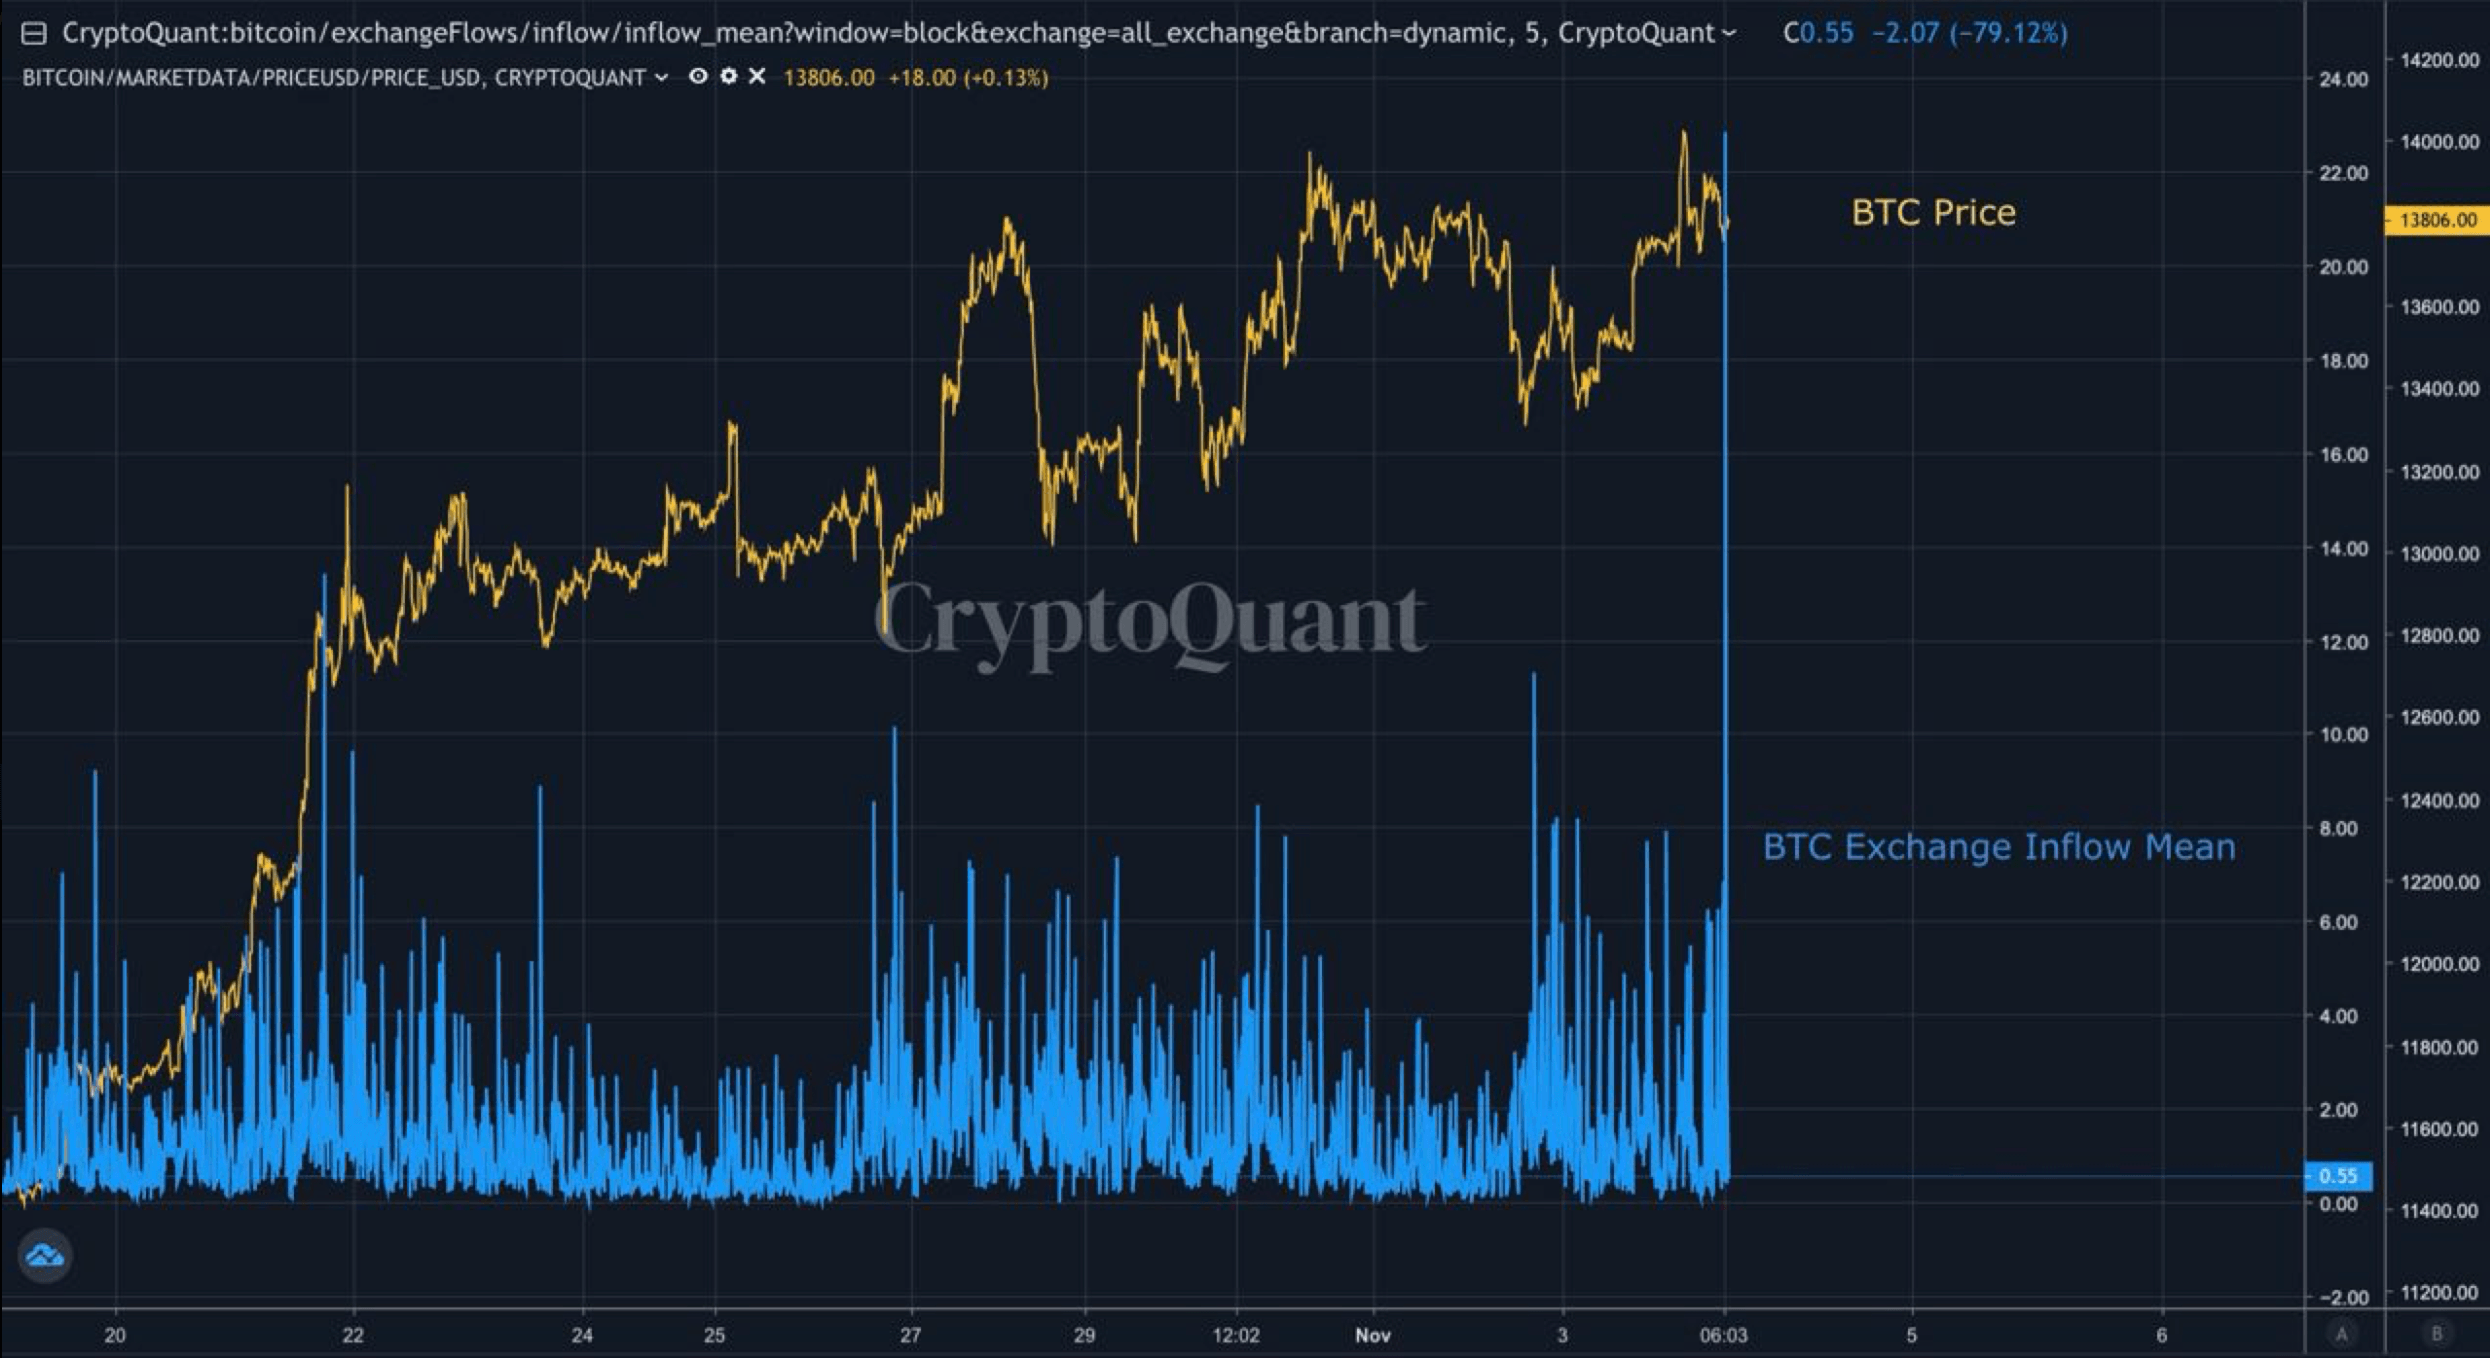
BTC Exchange Inflow chart
Such a spike in BTC's exchange inflow seems to be correlated with a massive number of dormant tokens exchanging hands over the past 24 hours. Santiment's Age Consumed chart recorded the most significant number of idle tokens being transferred since July 2019. This metric adds credence to the thesis that sell orders are piling up.
 [14.52.40, 04 Nov, 2020]-637400953874877929.png)
BTC Age Consumed chart
If all of these bearish signals are validated, Bitcoin's price may dive towards $13,000 to re-test this psychological level. A further increase in supply around this price hurdle could push it to the next important area of interest, around $12,700. Here, roughly 700,000 addresses had previously purchased over 500,000 BTC, based on IntoTheBlock's IOMAP model.
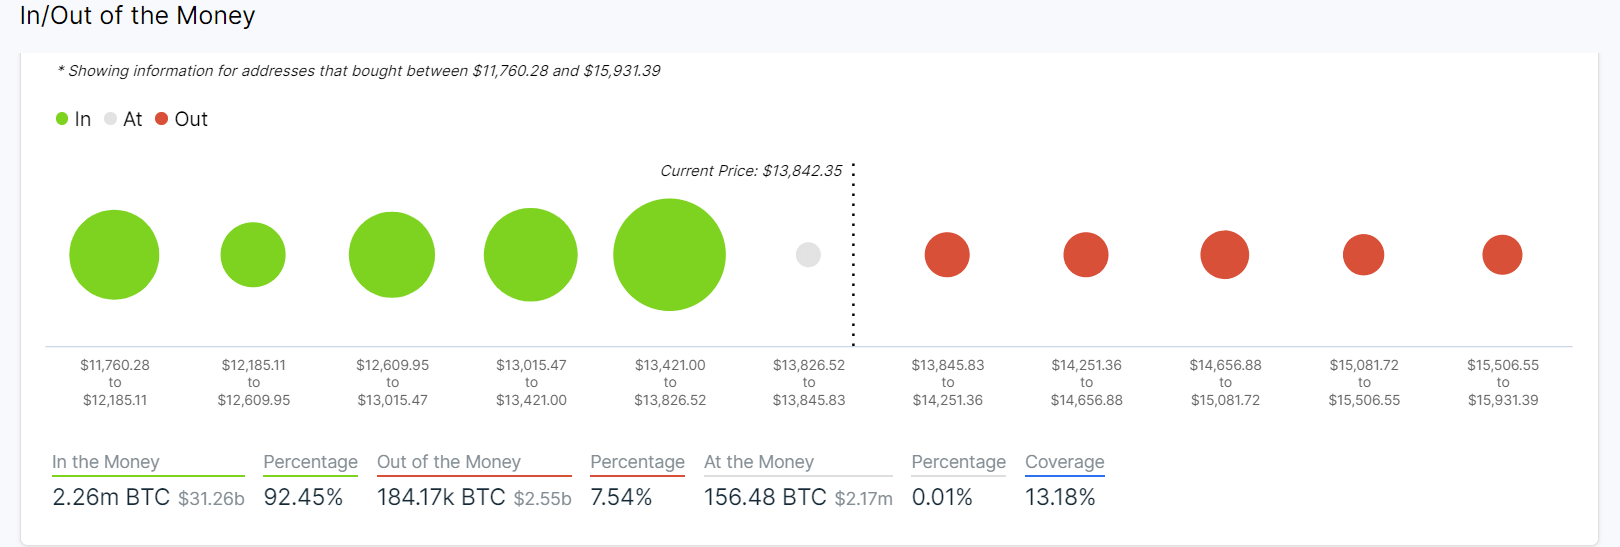
BTC IOMAP chart
It is worth mentioning that the IOMAP cohorts show virtually no resistance ahead of Bitcoin's price. The only area that may provide stiff resistance sits around $15,000, where 130,000 addresses bought 60,000 BTC. A breakout above this psychological hurdle can push prices towards $16,000.
Note: All information on this page is subject to change. The use of this website constitutes acceptance of our user agreement. Please read our privacy policy and legal disclaimer. Opinions expressed at FXstreet.com are those of the individual authors and do not necessarily represent the opinion of FXstreet.com or its management. Risk Disclosure: Trading foreign exchange on margin carries a high level of risk, and may not be suitable for all investors. The high degree of leverage can work against you as well as for you. Before deciding to invest in foreign exchange you should carefully consider your investment objectives, level of experience, and risk appetite. The possibility exists that you could sustain a loss of some or all of your initial investment and therefore you should not invest money that you cannot afford to lose. You should be aware of all the risks associated with foreign exchange trading, and seek advice from an independent financial advisor if you have any doubts.
Recommended Content
Editors’ Picks
Ripple on-chain metrics show bullish signs amidst legal struggle with SEC, XRP eyes recovery

Ripple made a comeback above $0.48 on Tuesday and hovers above that level in Wednesday’s European session. Ripple on-chain metrics such as transaction volume and Network Realized Profit/Loss have turned bullish, supporting a recovery in the altcoin.
Bitcoin price falls amidst German government transfers, miners activity

Bitcoin (BTC) extends correction on Wednesday and hovers around $61,000 after finding resistance near the $64,000 level on Monday. Recent on-chain data indicates heightened selling activity from Bitcoin miners early in the week.
Crypto Today: Bitcoin erases gains from end of June, Ethereum declines while Ripple holds

Bitcoin wipes out gains from the last week of June and falls below $60,000 on Wednesday. Ethereum and top altcoins ranked by market capitalization erased gains as the inflation outlook worsened. Ripple holds on to recent gains and hovers above $0.48 on Wednesday.
Three reasons why altcoins could shake off losses this week

On-chain data from Santiment shows that altcoins are currently in the opportunity zone, or generating buy signals. The top three altcoins in the buy zone are Basic Attention Token (BAT), Chromia (CHR), and Highstreet (HIGH), per Santiment.
Bitcoin: BTC price correction could end in July, according to seasonal data

Bitcoin (BTC) price appears poised for a decline this week, influenced by slight outflows in US spot ETFs, selling activity among BTC miners, and a combined transfer of 4,690.28 BTC to centralized exchanges by the US and German governments.