XAU/USD – Testing 100% support arc, bearish momentum may pause awaiting breakdown or rebound


Gold spot/US Dollar (XAU/USD): Arc cycle analysis™
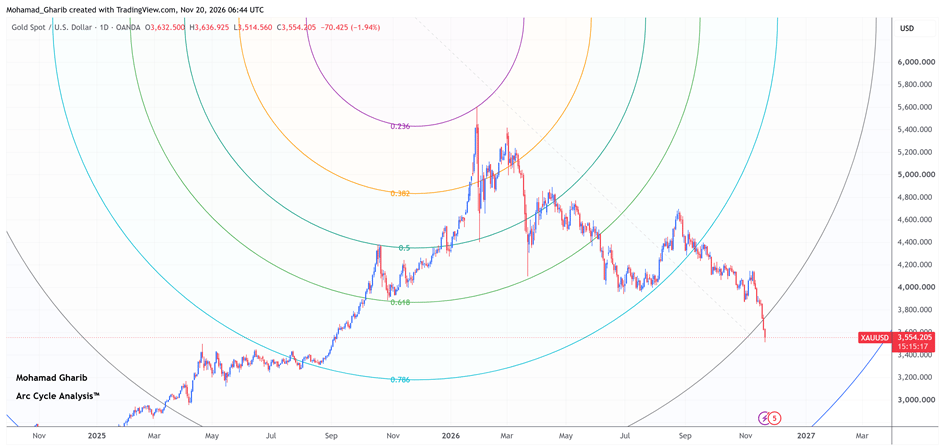
Figure 1: XAUUSD 1D chart with Arc Cycle levels. Gold Spot/U.S. Dollar (XAUUSD) on the 1D chart with the Arc Cycle levels used in this analysis. Source: TradingView chart; Arc Cycle Analysis™ by Mohamad Gharib.
Overview
Based on Arc Cycle Analysis™ applied to the 1D chart, Gold is trading around the 1 (100%) Support Arc. The downtrend may take a pause or rest at this Arc before its next directional move. The break of the 1 (100%) Arc cannot be confirmed yet, and the preferred approach is to await a clear reaction at the Arc before anticipating the next move.
Table 1: XAUUSD Arc Cycle Analysis summary.
Metric | Reading |
Market Bias | Bearish |
Preferred Scenario | Pause / Rest at the 1 (100%) Support Arc |
Arc Behavior | Break not yet confirmed |
Short-Term View | The downtrend may pause or rest at the Arc before the next directional move |
Current Arc Level | 1 (100%) Support Arc |
Cycle Status | Testing Support Arc |
Table 1: Key Arc Cycle readings for XAUUSD. Source: Arc Cycle Analysis™ by Mohamad Gharib.
Market outlook
Gold is trading around the 1 (100%) Support Arc after an extended decline. The downtrend may take a pause or rest at this Arc before its next directional move. The break of the 1 (100%) Arc cannot be confirmed yet, and the preferred approach is to await a clear reaction at the Arc before anticipating the next move.
Author
Mohamad Gharib
Independent Analyst
Mohamad Gharib is a Financial Markets Analyst and Quantitative Researcher with more than 18 years of experience in financial markets, including 15 years as an FX Quant Trader.

















