USD/JPY Elliott Wave technical analysis [Video]
![USD/JPY Elliott Wave technical analysis [Video]](https://editorial.fxstreet.com/images/Markets/Currencies/Majors/USDJPY/japanese-yen-currency-and-dollar-bank-note-60447532_XtraLarge.jpg)
USD/JPY Elliott Wave technical analysis
Function: Counter Trend.
Mode: Corrective.
Structure: Orange Wave 4.
Position: Navy Blue Wave 1.
Direction next lower degrees: Orange Wave 5.
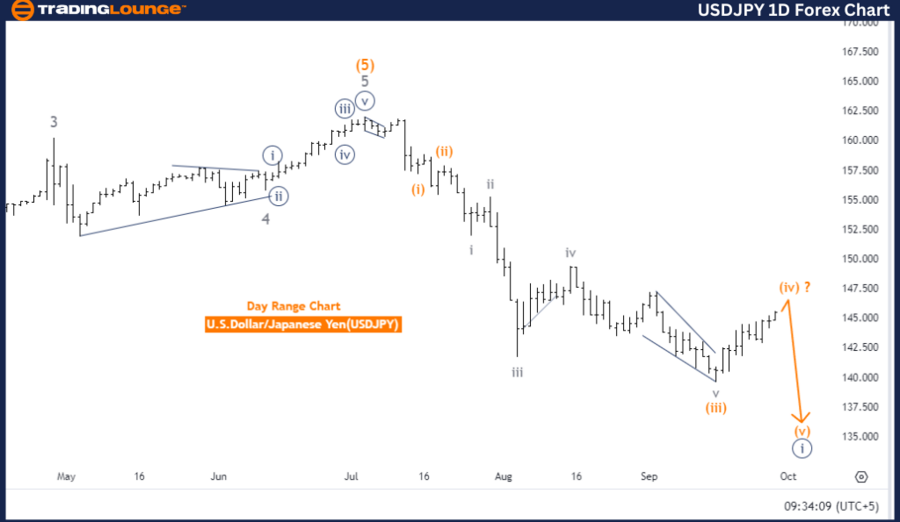
Details: Orange Wave 3 appears complete, with Orange Wave 4 currently in play.
The USDJPY Day Chart, analyzed with Elliott Wave theory, shows the market in a corrective phase, which represents a counter-trend move. The observed structure is Orange Wave 4, a temporary correction phase within the larger trend, typically following an impulsive wave.
The market's current position is within Navy Blue Wave 1, signaling the beginning of a new wave cycle. Navy Blue Wave 1 suggests that the next significant movement will be to the downside as Orange Wave 4 advances toward Orange Wave 5.
According to the analysis, Orange Wave 3 has completed, marking the end of an upward impulsive move. Orange Wave 4 is now active, indicating a corrective phase consistent with typical wave 4 behavior. Upon completion of Orange Wave 4, the market is expected to transition into Orange Wave 5, resuming the overall upward trend within the wave cycle. Orange Wave 5 will act as the final impulsive wave in this sequence, completing the broader wave structure.
In summary, the USDJPY Day Chart reflects a corrective phase in Orange Wave 4, following the conclusion of Orange Wave 3. The market is positioned within Navy Blue Wave 1, suggesting the beginning of a new wave cycle. After Orange Wave 4 concludes its correction, the chart anticipates a move into Orange Wave 5, continuing the overall upward trend. The current focus is on the completion of Orange Wave 4 before the next impulsive upward move begins with Orange Wave 5.
U.S. Dollar / Japanese Yen (USDJPY) 4-Hour Chart
USD/JPY Elliott Wave technical analysis
Function: Counter Trend.
Mode: Corrective.
Structure: Orange Wave 4.
Position: Navy Blue Wave 1.
Direction next lower degrees: Orange Wave 5.
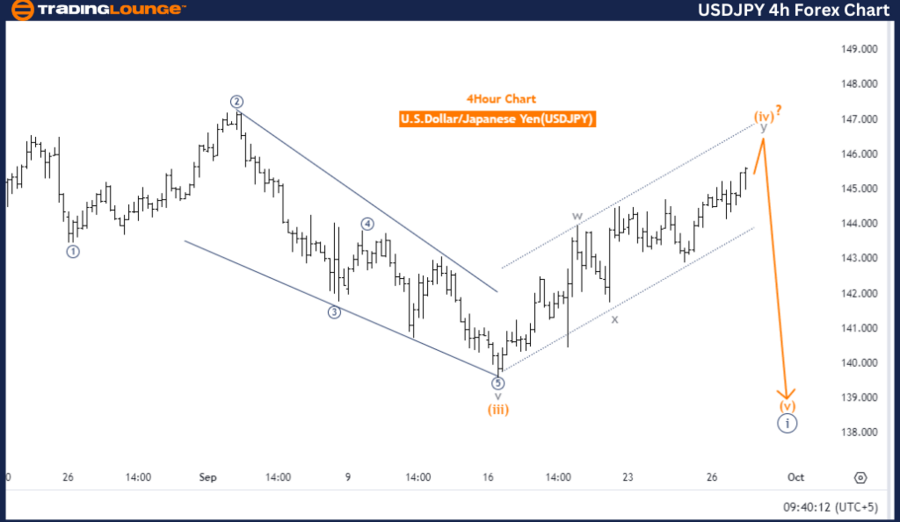
Details: Orange Wave 3 appears completed, with Orange Wave 4 now in progress.
The USDJPY 4-Hour Chart, based on Elliott Wave principles, indicates the market is currently in a corrective phase, representing a counter-trend move within the broader wave structure. The present structure being observed is Orange Wave 4, which follows an impulsive wave and typically serves as a corrective phase.
According to the analysis, the market is positioned within Navy Blue Wave 1, indicating the early stages of a new wave cycle. This wave sets the groundwork for future price movements within the cycle, with the next expected direction leading toward Orange Wave 5, once Orange Wave 4 finishes its corrective action.
The analysis details suggest that Orange Wave 3 has likely reached its conclusion. Following this impulsive wave, Orange Wave 4 is now unfolding and is expected to bring a temporary counter-trend correction before the market resumes its bullish trend into Orange Wave 5. When Orange Wave 5 begins, it will extend the upward trend and complete this wave sequence.
In summary, the USDJPY 4-Hour Chart reflects a corrective phase with Orange Wave 4 currently in progress. The completion of Orange Wave 3 has paved the way for this correction, and the market is preparing for the next impulsive wave, Orange Wave 5. Navy Blue Wave 1 indicates the initial phase of a broader wave structure, and once Orange Wave 4 completes, an upward move into Orange Wave 5 is anticipated.
USD/JPY Elliott Wave technical analysis [Video]
Author

Peter Mathers
TradingLounge
Peter Mathers started actively trading in 1982. He began his career at Hoei and Shoin, a Japanese futures trading company.


