USD/CAD Elliott Wave technical analysis [Video]
![USD/CAD Elliott Wave technical analysis [Video]](https://editorial.fxstreet.com/images/Markets/Currencies/Majors/USDCAD/dollars-11347249_XtraLarge.jpg)
USD/CAD Elliott Wave Analysis.
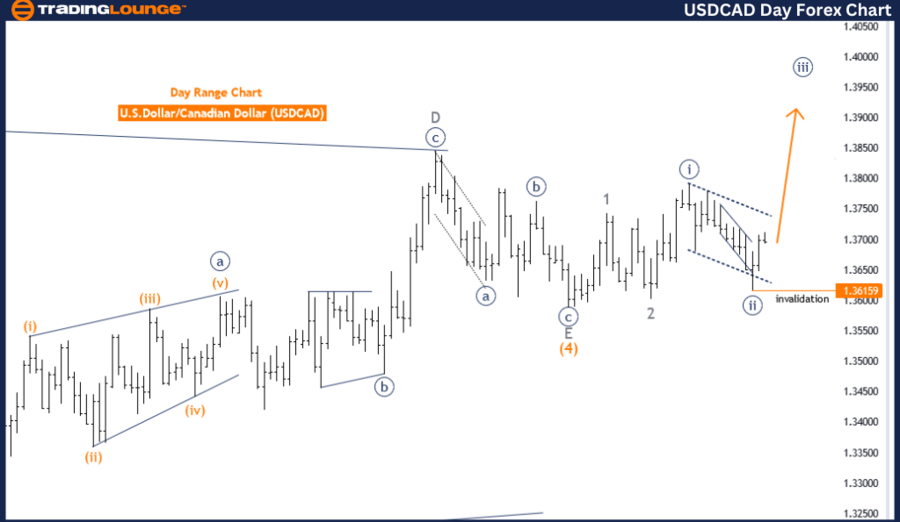
USD/CAD Daily Chart Analysis.
USD/CAD Elliott Wave Technical Analysis
Function: Trend.
Mode: Impulsive.
Structure: Navy Blue Wave 3.
Position: Gray wave 3.
Next higher degrees direction: Navy blue wave 3 (started).
Details: Navy blue wave 2 completed at 1.36743, now navy blue wave 3 of 3 is in play. Wave cancel invalid level: 1.36159
The USD/CAD Elliott Wave analysis on the daily chart provides a comprehensive view of the market trend based on Elliott Wave Theory. This analysis classifies the market function as a trend with an impulsive mode, indicating a strong and sustained movement in the primary trend direction.
The current market structure is identified as navy blue wave 3, a crucial phase in the larger wave pattern. The market is positioned in gray wave 3, a sub-wave within the navy blue wave 3 structure, indicating a significant and forceful movement typical of the third wave in Elliott Wave theory, which is known for its strength and extension.
The direction for the next higher degrees remains focused on navy blue wave 3, suggesting that this primary wave has begun and is progressing. The analysis indicates that navy blue wave 2 has been completed at the level of 1.36743, marking a pivotal transition point and setting the stage for the current movement within navy blue wave 3 of 3.
Navy blue wave 3 of 3 is currently in play, typically indicating a period of robust market activity and potential acceleration in the trend direction. This wave is one of the most powerful and extended waves within the Elliott Wave sequence, often driving significant market advances.
A crucial part of this analysis is the wave cancellation invalid level, set at 1.36159. This level acts as a key threshold; if breached, it would invalidate the current wave count and require a reevaluation of the Elliott Wave structure. It is essential to maintain above this level to continue the identified wave pattern.
Summary
-
Trend: Impulsive mode within navy blue wave 3, positioned in gray wave 3.
-
Completion: Navy blue wave 2 completed at 1.36743, advancing through navy blue wave 3 of 3.
-
Invalidation Level: Critical wave cancellation level at 1.36159 to sustain the current wave count and confirm the ongoing trend direction.
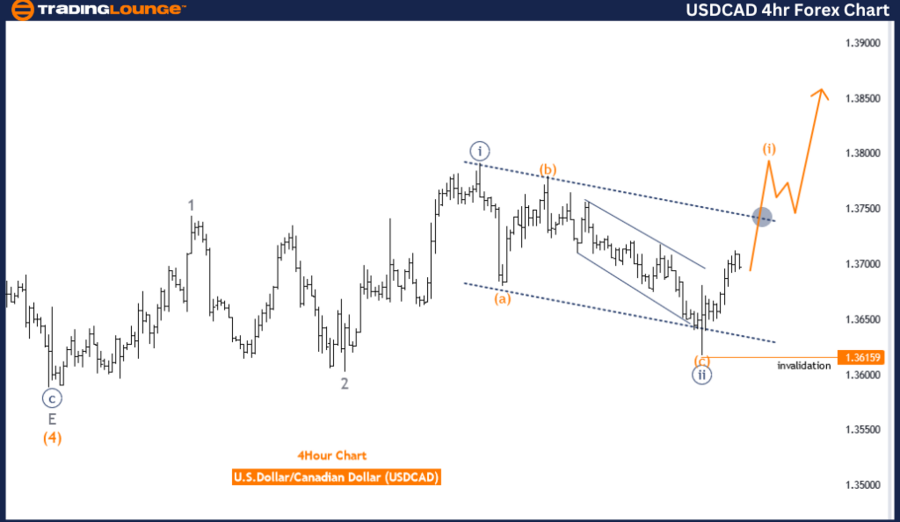
USD/CAD 4-Hour Chart Analysis.
USD/CAD Elliott Wave technical analysis
Function: Trend.
Mode: Impulsive.
Structure: Orange wave 1.
Position: Navy Blue Wave 3.
Next lower degrees direction: Orange wave 2.
Details: Navy blue wave 2 completed at 1.36743, now orange wave 1 of 3 is in play. Wave cancel invalid level: 1.36159.
The USD/CAD Elliott Wave analysis on the 4-hour chart provides an in-depth look at the market trend using Elliott Wave Theory. This analysis identifies the trend as impulsive, indicating a strong directional movement aligned with the primary trend.
The current market structure is identified as orange wave 1, indicating the market is in the early stages of a new upward movement. The position within this structure is navy blue wave 3, a significant part of the larger trend. Navy blue wave 3 typically signifies a strong and extended movement, indicating a robust phase of market activity.
The direction for the next lower degrees points to orange wave 2, which will follow the completion of the current orange wave 1. Orange wave 2 is expected to be a corrective phase, providing a retracement or consolidation after the impulsive movement of orange wave 1. This phase is crucial for maintaining the overall market structure and preparing for the next impulsive wave.
The analysis details highlight that navy blue wave 2 appears to have been completed at the level of 1.36743. This completion sets the stage for the current orange wave 1 of 3, which is now in play. Orange wave 1 of 3 represents the beginning of a new impulsive trend, characterized by strong upward movement and potential market gains.
A critical aspect of the analysis is the wave cancellation invalid level, set at 1.36159. This level acts as a crucial threshold that, if breached, would invalidate the current wave count. The invalidation of the wave count would necessitate a reassessment of the Elliott Wave structure and potentially alter the market outlook.
Summary
-
Trend: Impulsive phase within orange wave 1, positioned in navy blue wave 3.
-
Completion: Navy blue wave 2 completed at 1.36743, advancing through orange wave 1 of 3.
-
Invalidation Level: Critical wave cancellation level at 1.36159 to sustain the current wave count and confirm the ongoing trend direction.
Technical analyst: Malik Awais.
USD/CAD Elliott Wave technical analysis [Video]
Author

Peter Mathers
TradingLounge
Peter Mathers started actively trading in 1982. He began his career at Hoei and Shoin, a Japanese futures trading company.


