US Election effect on Gold: Historical pattern unlikely to be followed

This has been the year of surprises. First Brexit then Colombia peace agreement referendum coupled with the bevy of ‘surprising’ elections in Greece, France, Germany, and Austria. The question everyone is asking now is will we have a surprise result of US elections?
US election ‘surprise’ means Trump victory. The republican candidate has been buried by media for pressing all the wrong buttons through his presidential campaign. Markets do not like Trump as well. On the other hand, Clinton is good for risk assets and is widely expected to win the elections.
In this report, we take a look at the possible action in gold post election results.
Gold – Will it follow the historical pattern?
Gold has rallied from December 2015 low of $1046 to as high as $1376 by July 2016. The rally was followed by a retreat to $1250 levels. Frantic search for yield amid falling fed rate hike bets and negative rates/yields across the advance world fuelled the rally in gold. Meanwhile, the retreat from the July highs was due to increase in Fed rate hike probability in December.
Some historical data about Gold and US elections
- Democratic presidents usually cause gold prices to go up and the dollar to decrease in value
- How stocks behave after an election usually depends on which party is in office – markets rise the year after the election more often when a Republican is elected than when a Democrat takes office. But gold tends to rise regardless of who’s in office.
- Gold usually drops heading into the election
- The 12-month period leading to 2004, 2008 and 2012 elections resulted in a decrease in gold prices prior to the election
- A second term for a president is usually good for gold price
- Prices jumped immediately after George W. Bush (Republican) was re-elected in 2004. Prices jumped 8% in a month after the election before pulling back for a net 3.5% gain by year’s end.
- Gold had rallied astounding 21.5% in the two-month period post-Obama’s victory in 2008.
Comparison of current price action in gold and point number 4 suggests the metal has partially followed the historical pattern. Prices are up compared to last October ($1180). However, over the last one month, prices have declined.
Point number 2 null and void
History shows a Republican President is good for stocks. However, equities and markets in general do not like Republican candidate Donald Trump. On the other hand, Democrat victory leads to gold rally. But once again, the pattern is unlikely to be followed because Clinton victory would mean less uncertainty and heightened odds of Fed rate hike in December.
Trump’s victory and a possible shake-up in the markets would force Fed to delay its rate hike. The resulting drop in the yields in US and other parts of the world would mean increased demand for gold not only due to safe haven appeal but due to hunt for yield as well.
Long run bullish view to remain intact irrespective of Trump or Clinton victory
Election results won’t matter unless the new President, whoever it is that talks about gold standard. Moreover, the global scenario – new normal will remain unchanged post elections.
Election doesn’t affect the upcoming switch from monetary stimulus to fiscal stimulus
Central banks across the advanced world stand exhausted and are being forced to steepen the yield curve despite anemic growth. Hence, central governments (fiscal stimulus) are likely to take over from central banks (monetary expansion). This does not mean interest rates would go higher. Moreover, the world is heading towards a combination of fiscal stimulus + ultra low rates. The equation looks super-bullish for gold.
Central bank exhaustion only means rates cannot go deeper into the negative territory. Moreover, a further drop into negative territory by itself is bullish for gold.
Note that fiscal stimulus is inflationary….more than monetary easing. That is supportive for gold.
Trump is widely expected to slash taxes and resort to massive spending in order to boost growth. On the other hand, Clinton is likely to be more conservative with spending effort. However, spending is inevitable; hence the long-run outlook for gold remains bullish.
And last but not least – Remember that we are operating in the ‘new normal’ – unprecedented times. Hence, the historical patterns may not be followed at all.
The conclusion is –
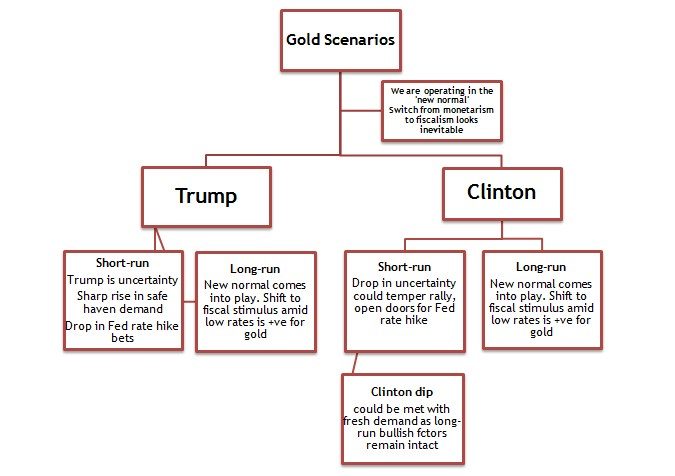
- In the short-run – Trump victory would be super-bullish for gold, while Clinton victory may lead to further losses in anticipation of a rate hike in December.
- In the long-run – Outlook for gold remains bullish. The Clinton-dip in gold is thus a buying opportunity, given that Fiscalism is likely to take over from Monetarism in the long-run.
- In the background, we also have strengthening oil prices, resulting in higher inflation expectations. That could further underpin demand for the metal.
Gold Scenarios
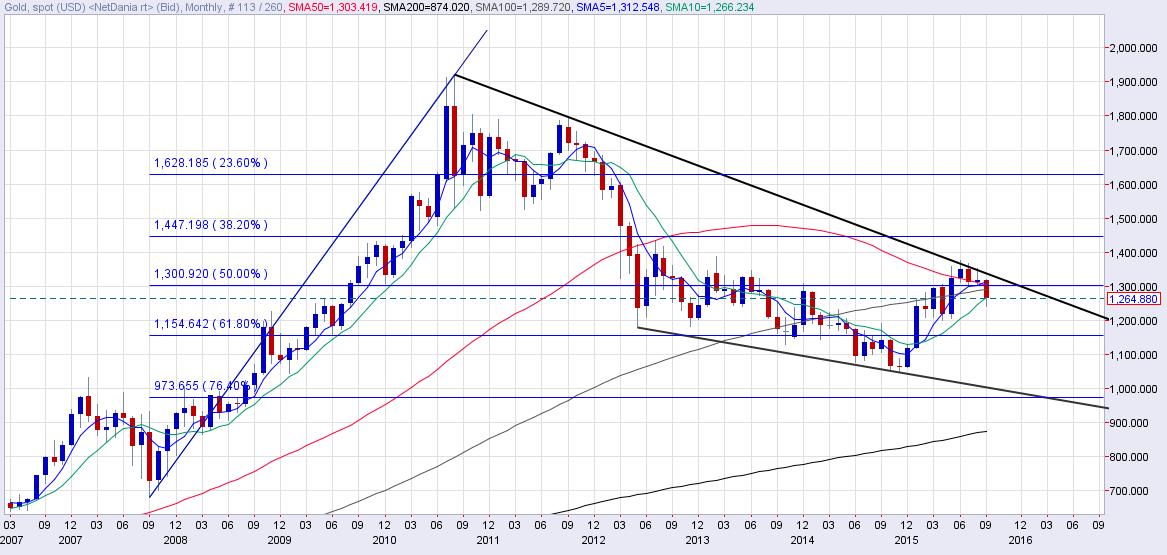
Gold – Monthly chart
- ‘Clinton Dip’ could see prices test $1154.62 (61.8% Fibo retracement)
- If Trump wins, gold could see a Brexit style jump (but a much bigger one) to $1447.20 (38.2% Fibo). Gains could be extended further depending on how markets react. Gold could extend gains to $1500-1550 if risk-off worsens further.
- If markets make a quick recovery from Trump debacle (like the one seen after Brexit dip) – gold could slowly give up gains.
- On the monthly chart, we can also see a flag and pole formation. A weekly close above flag resistance would signal a reversal of a 4-year long (2011 to 2015) downtrend.
Dollar index
As mentioned earlier, Trump is uncertainty…a black swan for many. Furthermore, Trump wants to bring jobs back to America, which means he is in favor of a weaker currency. Importing jobs/stealing jobs means importing foreign demand via weak currency.
However, in the short-run increased demand for safe haven treasuries could keep the dollar bid, especially against EM and risk currencies – AUD, NZD and other majors except the Yen. That would ensure the dollar index remains sideways to negative despite the drop in the Fed rate hike bets.
Clinton victory would cement expectations of a December Fed rate hike and thus could lead to another leg higher in Dollar index….heading into Dec Fed meeting.
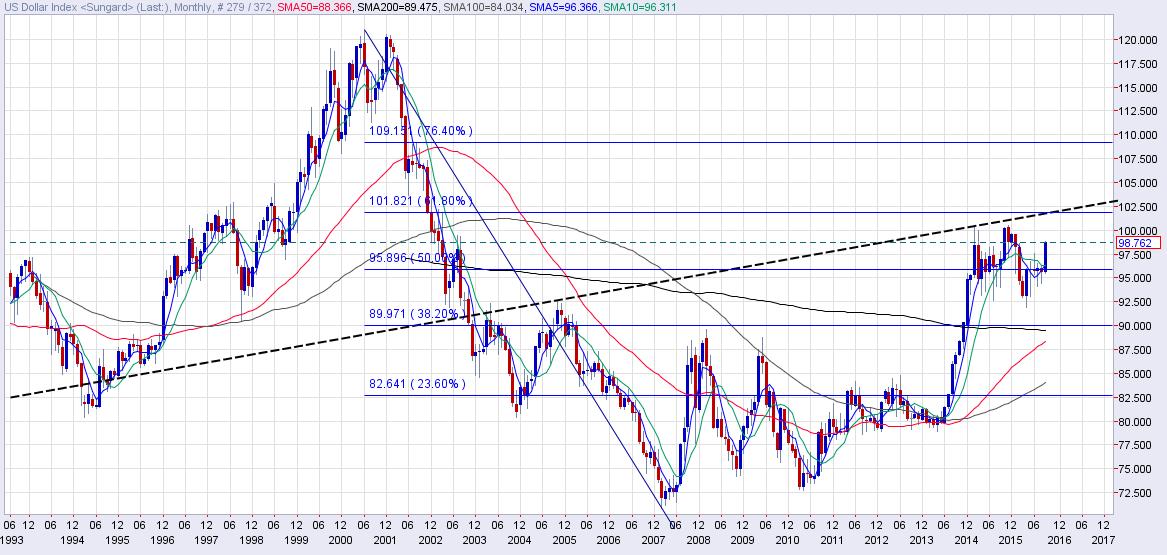
DXY Monthly chart
- We can see a larger inverse head and shoulder with a neckline that coincides with 61.8% retracement level of 101.82.
- On the lower side, a break below 91.92 would signal the rally from 2007 lows has come to an end.
Author

Omkar Godbole
FXStreet Contributor
Omkar Godbole, editor and analyst, joined FXStreet after four years as a research analyst at several Indian brokerage companies.


