Speculative bubble
Equities puzzled investors lately. A market crash led to a v-shaped rally that carried the broad market near all-time highs. It was the sharpest recovery for U.S. equities throughout our entire dataset that spans over 150 years. Moreover, that happened during the most significant economic crisis since the Great Depression. This write-up discusses the reasons behind the most recent rally and shows that fundamentals are likely to end the party very soon.
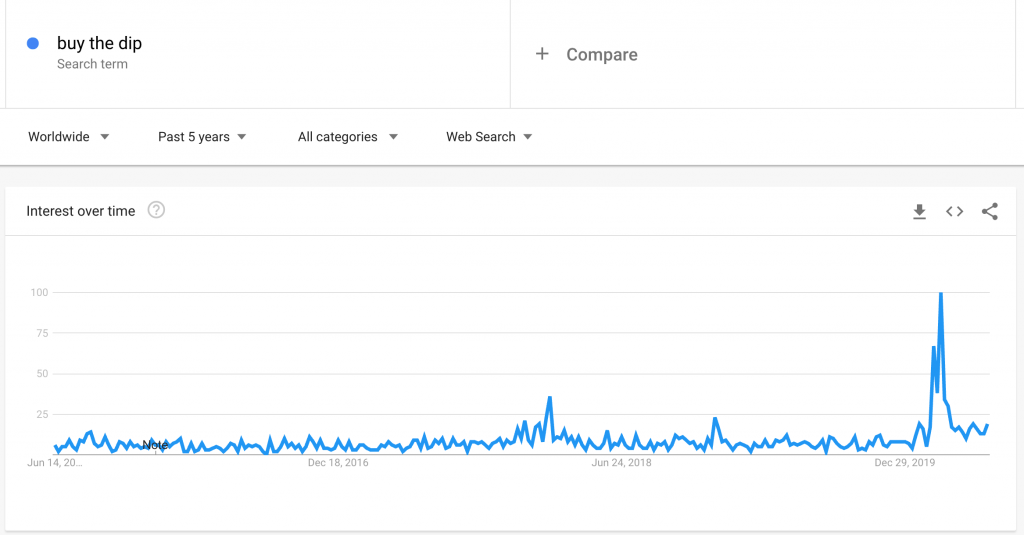
Source: Google
Speculation
A speculative bubble is probably the dominating force that drove equities up. The prevailing narratives are that equities always increase, the Fed prevents markets from falling, and “buy the dip” is a profitable investment strategy. Not surprisingly, investors had that in mind as equities tumbled earlier this year. The first chart shows worldwide google searches for the string “buy the dip” over the past five years. These peaked during the mid-March selloff and retail investors rushed in to buy the dip. Evidence, such as Robinhood holdings and small trader call option positioning, confirms the thesis that the rally was driven by speculative demand. Liquidity from retail investors found its way into the market in an unprecedented manner.
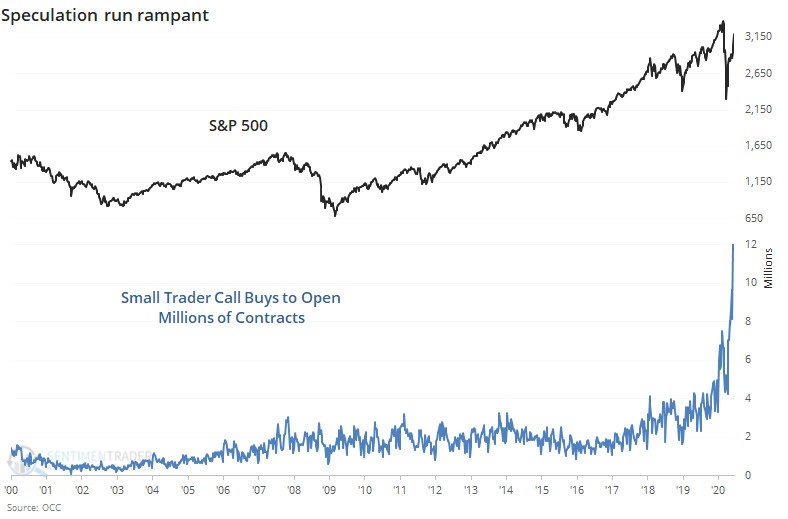
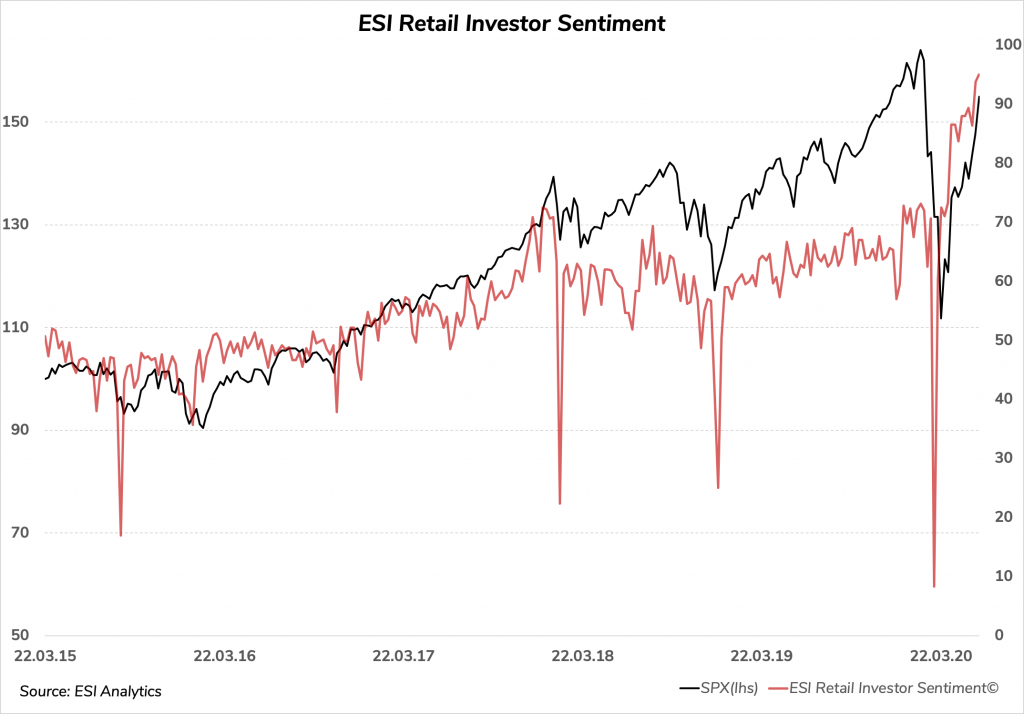
Source: sentimentrader.com
Fundamentals
Fundamentals do not confirm the most recent rally. Long-term valuation gauges, such as the 10-year cyclically-adjusted P/E ratio (CAPE), show that U.S. equities are very expensive relative to the past 150 years. CAPE is trading well above 30 versus its long-term average of roughly 17. Reality catches up with fantasy sooner or later. A pandemic led to the most severe recession since the Great Depression.

Source: Guggenheim Investments, S&P Global Ratings
The economy did not rebound in a v-shaped manner as equities suggest. Instead, businesses burned capital during the lockdown and a wave of defaults is right ahead of us. The chart above compares the previous two crises to today’s environment. Broad-based unemployment is likely to bring the default rate closer to what we witnessed in 2009 than in 2000. That will pull out liquidity from financial markets and catch retail speculators with their pants down.
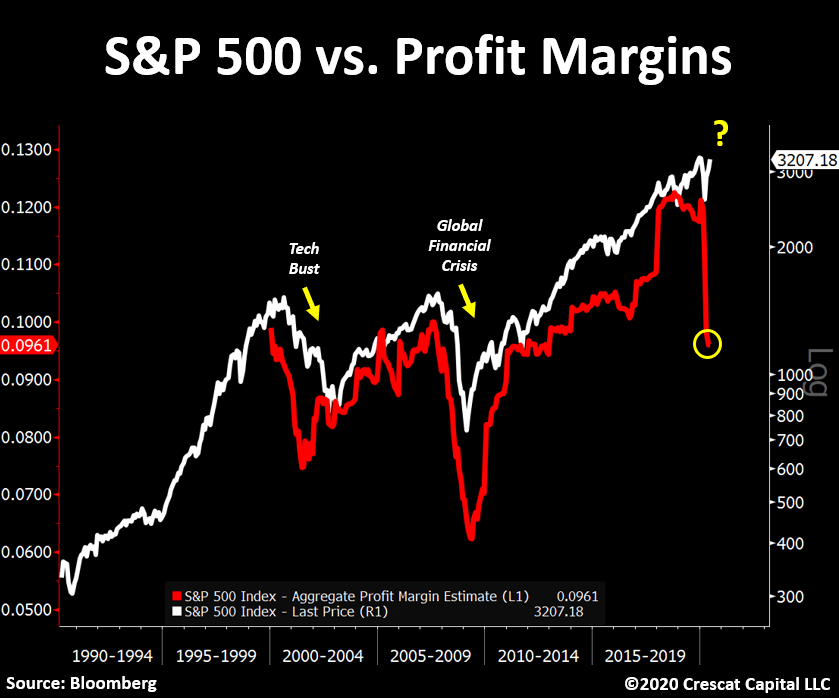
Source: Bloomberg, Crescat Capital LLC
Conclusion
The running gag became that “Robinhood traders are longer irrational than hedge fund managers solvent”. However, sentiment indicators signal that retail is all in already. Moreover, technicals reveal the first signs of exhaustion for equities. Another attack towards the most recent highs is likely but does not invalidate the case for a subsequent bear market. Short-term strength indicators signal residual buying demand, which hints to a final leg of roughly 10% above Thursday’s low. Nonetheless, mid-term risks overweight on the downside and a sustained break below 2,950 in the S&P 500 signals that the party is over. The bottom line is that evidence suggests that the trend is about to reverse. Fundamentals are going to pop the speculative bubble probably sooner rather than later.
Interested in more of our ideas? Check out Scienceinvesting for more details!
Author

Science Investing Team
Science Investing


