NVDA: The turnaround

S&P 500 dipped a little after weak ADP employment change, and then surged on disastrous services PMI. Bonds rose, and SPY rally broadened beyond tech towards the closing bell more significantly. As if it weren‘t broad in the first place, with high beta names run further strengthened by NVDA turning around.
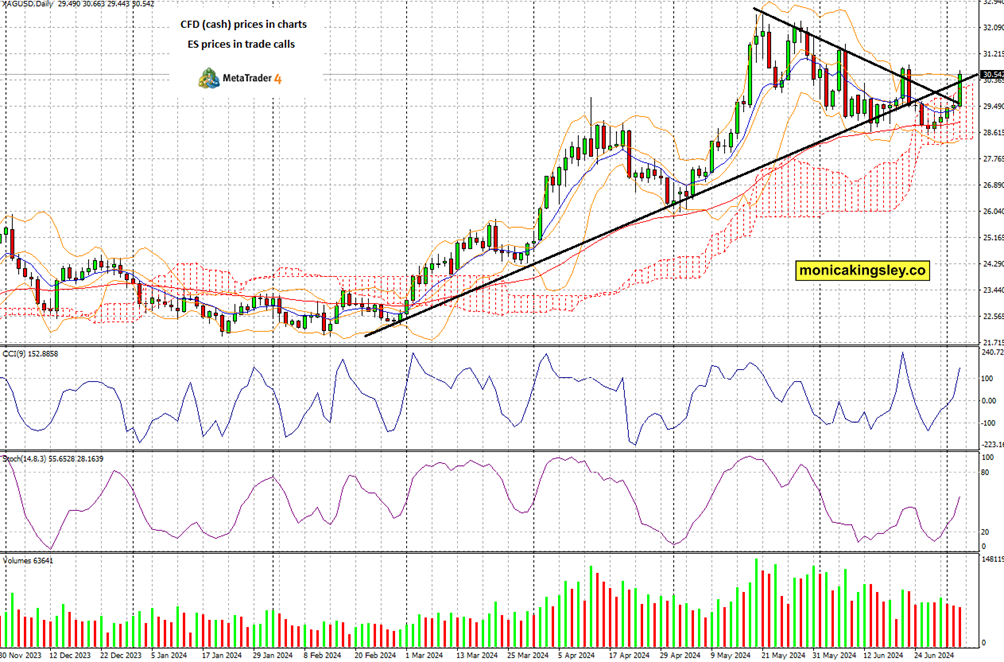
Objectively bad data (services PMI) was celebrated by rising bond prices and rate cut odds (the no cut in Sep one moved from prior week‘s 30s% range to only 27%), highlighting the common denominator. Gold with silver made technically important moves (that need still confirmation, see below the plain chart annotated for clients), copper rose and so did oil – while the dollar declined yet another day, way below the Apr talked target of 106.50, and Bitcoin yet again failed to kick in.
Yield curve steepening (bear steepening) though continued, and this – together with the conflicting signals several assets are sending – makes it essential to examine big picture style. Inversions of yield curve, Sahm rule and other recession / stagflation arrival tools are and will be increasingly more mentioned, and quite a few weeks earlier I‘ve stated that there is no imminent danger of recession.
How have these views, and especially various asset considerations changed over the last week? One can‘t complain we were getting boring data sparking predictable market reactions, or that the political landscape had been uneventful.
The following long thesis, set of questions and conclusions, is reserved for clients as regards the individual market implications.
Let‘s start with the first oddity of sharp increase in bond yields Friday and Monday that however didn‘t result in the dollar rising as well. Stocks held prior Tuesday‘s lows, and rebounded shortly before the dovish Powell appearance next to Lagarde. Bonds though haven‘t risen by nearly as much, and not even after the recessionary (below 50) reading on services PMI that sent rate cut odds surging.
Such a risk-on move in equities would also call for a broader commodities participation, yet the CRB Index remains sideways, with just gold and silver rising Friday – with their breakouts of the corrective patterns needing follow through strength. Retreating yields work great in precious metals‘ favor.
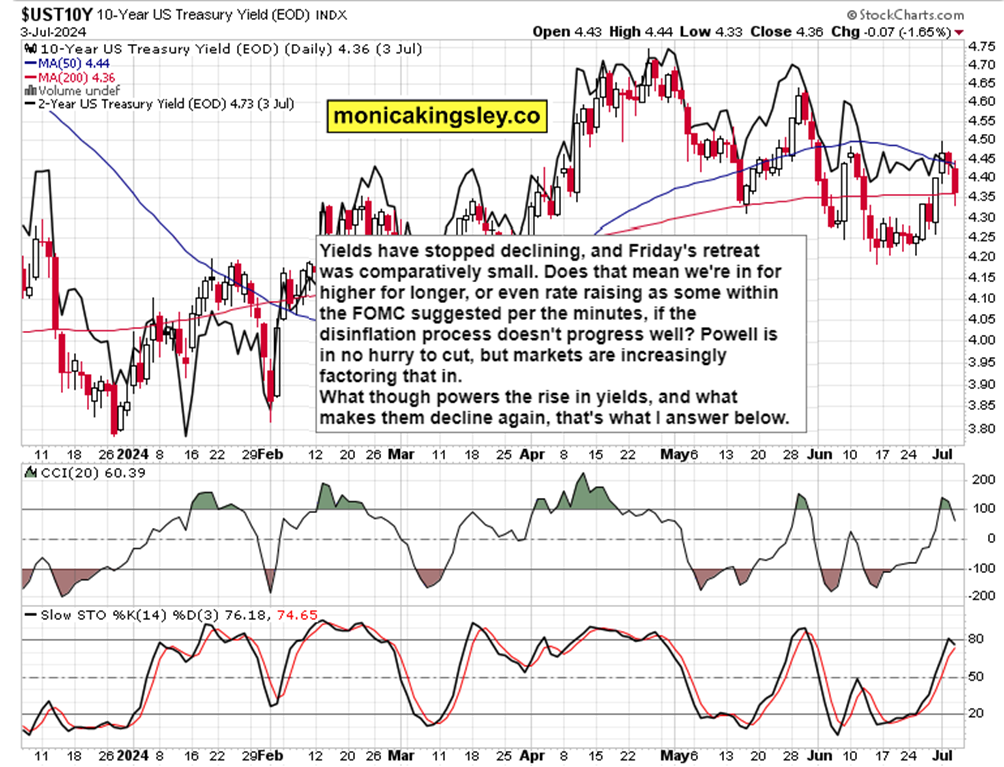
Answering the yields chart question, what powers the rise in yields? The Fed being unwilling to cut, because it could deem the disinflationary process as insufficiently progressing. Tuesday‘s dovish Powell appearance and subsequent set of weak economic data whether on the soft or hard landing side – the best hope is for synchronized global easing, one that wouldn‘t push the dollar up. So far so good, it keeps well below the Apr highs of 106.50 that I looked for to stop its rally back then.
The economy is weakening, but not yet slipping into recession – that time of clear recognition would come in early 2025. In spite of disappointing consumer confidence, retail sales and similar data, the consumer remains OK and spending, as discretionaries being among the better performing sectors say.
Stock market rotations are preventing the S&P 500 from declining much, and tech continues to lead on more than a semiconductors theme, with financials kicking in as the next leader. That‘s not the hallmark of a bear market, but of a bull one (talked early in the week). And for as long as bad incoming data is interpreted as bringing on rate cuts and improving equity risk premium, the rally continues.
Only when it becomes so bad that S&P 500 earnings yield goes down, that would hurt stocks. For as long as soft landing remains the mainstream bet, the stock market ascent can go on. The same applies to oil, which tends to spike before recessions (being among the last to peak, similarly to 2008) – that though drives up inflation, and in the current environment (all other things being equal, ceteris paribus) would lead to the realization that the Fed can‘t cut, and when consumers get squeezed (think also revenues decline) and inflation can‘t be passed onto them (in other words, CPI is lower than PPI) then margins get hurt, and declining earnings send stocks and P/E lower.
Whenever the fear or realization that the Fed can‘t cut to stimulate the economy hits, then bonds and stocks go down together – yields would rise in case the Fed doesn‘t project readiness to cut, and does not commit to yield curve control. Think also much harder national debt servicing.
But what do we have now? After prior month‘s great services PMI of 53.8 sliding to 48.8 , we got as well poor manufacturing PMI, its fourth monthly deterioration in a row. This week brought a missed opportunity for positive economic surprises, and this will continue for quite longer. An additional bonus would be better synchronized easing around the globe, leaving less room for the dollar to spike (other central banks being way more dovish than the Fed is a serious risk) and force a temporarily deflationary outcome (assets repricing).
This appreciation of Fed cutting is what‘s driving the QQQ:SPY ratio, the high beta preference and broadening stock market rally. Another sign pointing to this change in dynamics, would be increasing appeal of international stocks vs. US stocks.
So, for how long can the stock market upswing continue? Till the disinflationary trend goes on, and earnings remain more competitive relative to yield offered by Treasuries. Rising oil doesn‘t help inflation, but commodities aren‘t surging to spawn more inflation (so oil isn‘t yet breaking the party, can rise some more still). Just when sugar, another precursor to inflation, is bottoming and turning up. USD is though weak to spoil the risk-on party.
So that leaves it up to yields, how far they can run, and how that bear steepening progresses (long end rising faster). I wonder whether 10y yield can make it above 4.60% or say 4.65% in one go. Of course, it‘s also about when does the curve actually invert back to normal – usually, recession arrives only after that.
What would be then the earliest signs of trouble? Cryptos breaking down (wait, we have it with Bitcoin already), commodities likewise sliding (for now, they are just not rising strongly on prospects of more easing, so the jury is out on this one, except if gold with silver clearly go on to the next upleg (may or may not happen during the summer doldrums, see further). Another sign of trouble would be the end of disinflation mentioned above, as measured by core inflation metrics such as core PCE.
One more point about precious metals and yields – would their future allure be stronger than the yield offered by Treasuries? Would a stock market decline when recession starts hanging in the air later this year (the admissibility of this outcome), lead to inflows into precious metals? How much of the safe haven bid would the dollar get?
These are the key macroeconomic questions – where do we go from goldilocks / reflation? Would a deflationary whiff be strong enough to mess up with the eventual inflationary outcome – similar to what it did in the GFC of 2007-9 aftermath? So much depends on where yields and the dollar top, before declining lower.
This week, the question is whether celebrating the dive in services PMI was worthy of such a bond market reaction, and whether this decline in yields sticks in the very short-term. I‘m not sure it unequivocally will, but stocks are still insisting it would, more rate cut expectations / risks are being trotted out, and precious metals seem to agree with stocks… except that the dollar didn‘t slide worse. Therefore, I‘m inclined to think any potential yields spike longevity, would be limited.
It‘s a little mixed bag, and NFPs are the nearest piece in this puzzle – 194K expected vs. 272K prior is still looking much on the optimistic side to me. Private payrolls are 160K expected vs. 229K previous, but I‘m looking for a bit less than 150K, with government payrolls being the wildcard – them being only 8K early May vs. 72K in April was an outlier, and the Jun figure of 43K will be almost matched today. All in all, I‘m looking for some 175-185K non-farm payrolls today – and such a figure won‘t force rate cutting bets into retreat.
Let‘s mve right into the charts – today‘s full scale article contains 4 more of them, with commentaries.
Tired of seeing those red boxes instead of way more valuable information? Try the premium services based on what and how you trade.
Author

Monica Kingsley
Monicakingsley
Monica Kingsley is a trader and financial analyst serving countless investors and traders since Feb 2020.


