USD: Dec '24 is Up at 102.360.

Energies: Nov '24 Crude is Up at 76.33.

Financials: The Dec '24 30 Year T-Bond is Down 10 ticks and trading at 121.21.

Indices: The Dec '24 S&P 500 emini ES contract is 117 ticks Lower and trading at 5770.75.

Gold: The Dec'24 Gold contract is trading Up at 2676.00.

Initial conclusion

This is not a correlated market.  The USD is Up and Crude is Up which is not normal, but the 30 Year T-Bond is trading Lower.  The Financials should always correlate with the US dollar such that if the dollar is Higher, then the bonds should follow and vice-versa. The S&P is Lower and Crude is trading Higher which is correlated. Gold is trading Higher which is not correlated with the US dollar trading Up.  I tend to believe that Gold has an inverse relationship with the US Dollar as when the US Dollar is down, Gold tends to rise in value and vice-versa. Think of it as a seesaw, when one is up the other should be down. I point this out to you to make you aware that when we don't have a correlated market, it means something is wrong. As traders you need to be aware of this and proceed with your eyes wide open. Asia traded mainly Higher with the exception of the Sensex exchange.  Europe is trading Higher with the exception of the German Dax exchange. 

Possible challenges to traders

FOMC Member Bowman Speaks at 1 PM EST. This is Major.

FOMC Member Kashkari at 1:50 PM EST. This is Major.

Consumer Credit is out at 3 PM EST. This is Major. 

Traders, please note that we've changed the Bond instrument from the 10 year (ZN) to the 2 year (ZT).  They work exactly the same.  

We've elected to switch gears a bit and show correlation between the 2-year Treasury notes (ZT) and the S&P futures contract.  The YM contract is the Dow Jones Industrial Average, and the purpose is to show reverse correlation between the two instruments.  Remember it's likened to a seesaw, when up goes up the other should go down and vice versa.

On Friday the ZT migrated Higher at around 8:30 AM EST with no real economic news in sight and began its Downward slide.  Look at the charts below and you'll see a pattern for both assets. The Dow moved Higher at 8:30 AM and the ZT moved Lower at around the same time.  These charts represent the newest version of Bar Charts, and I've changed the timeframe to a 15-minute chart to display better.  This represented a Short opportunity on the 2-year note, as a trader you could have netted about 20 ticks per contract on this trade.   Each tick is worth $7.625.  Please note: the front month for ZT is Dec and the Dow is now Dec '24.  I've changed the format to filled Candlesticks (not hollow) such that it may be more apparent and visible.

Charts courtesy of barcharts

Chart

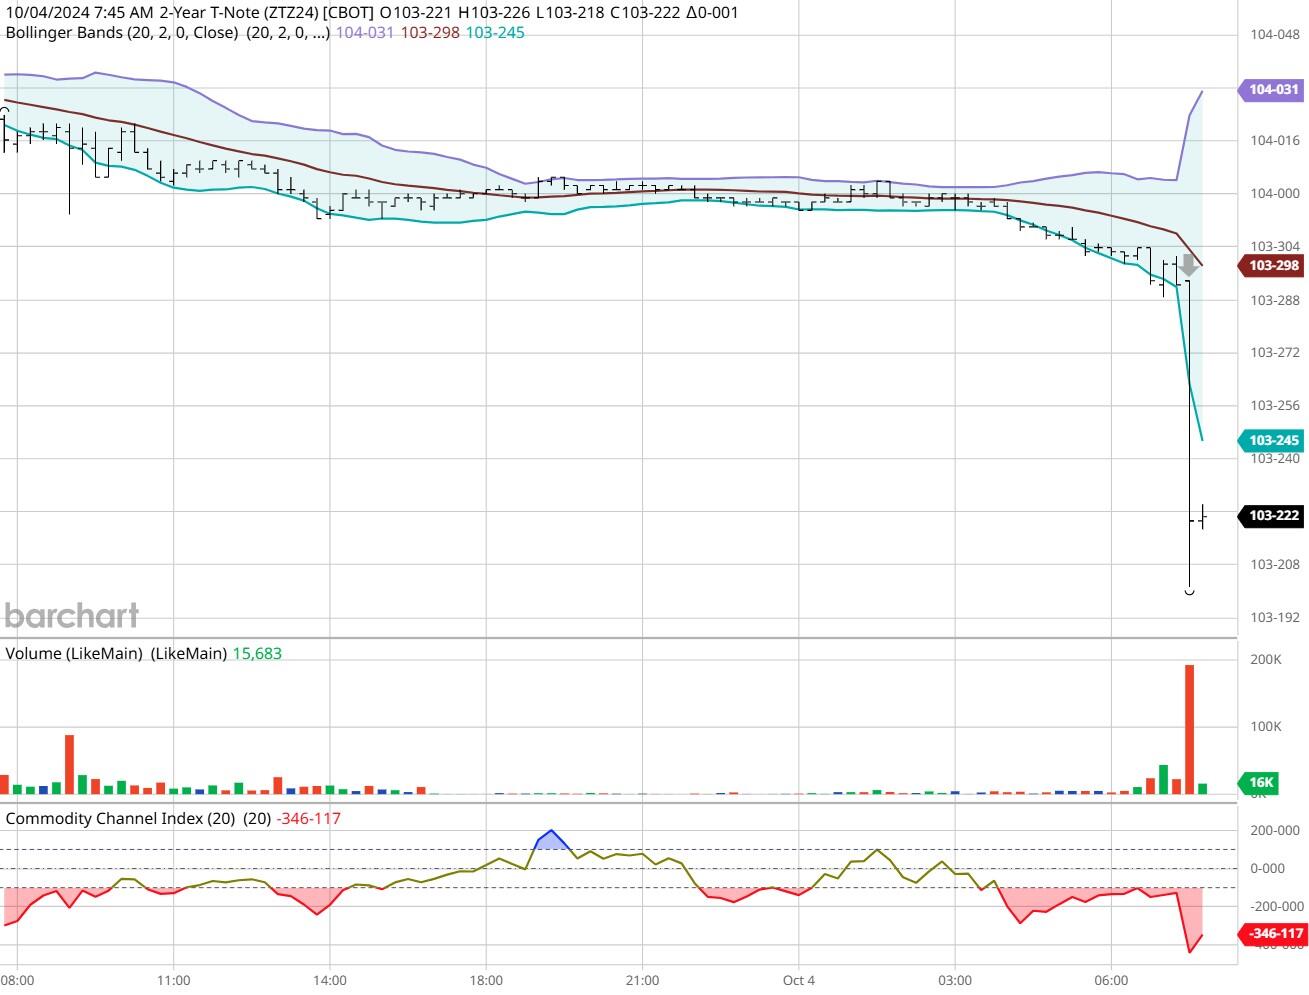
ZT -Dec 2024 - 10/04/24

DOW

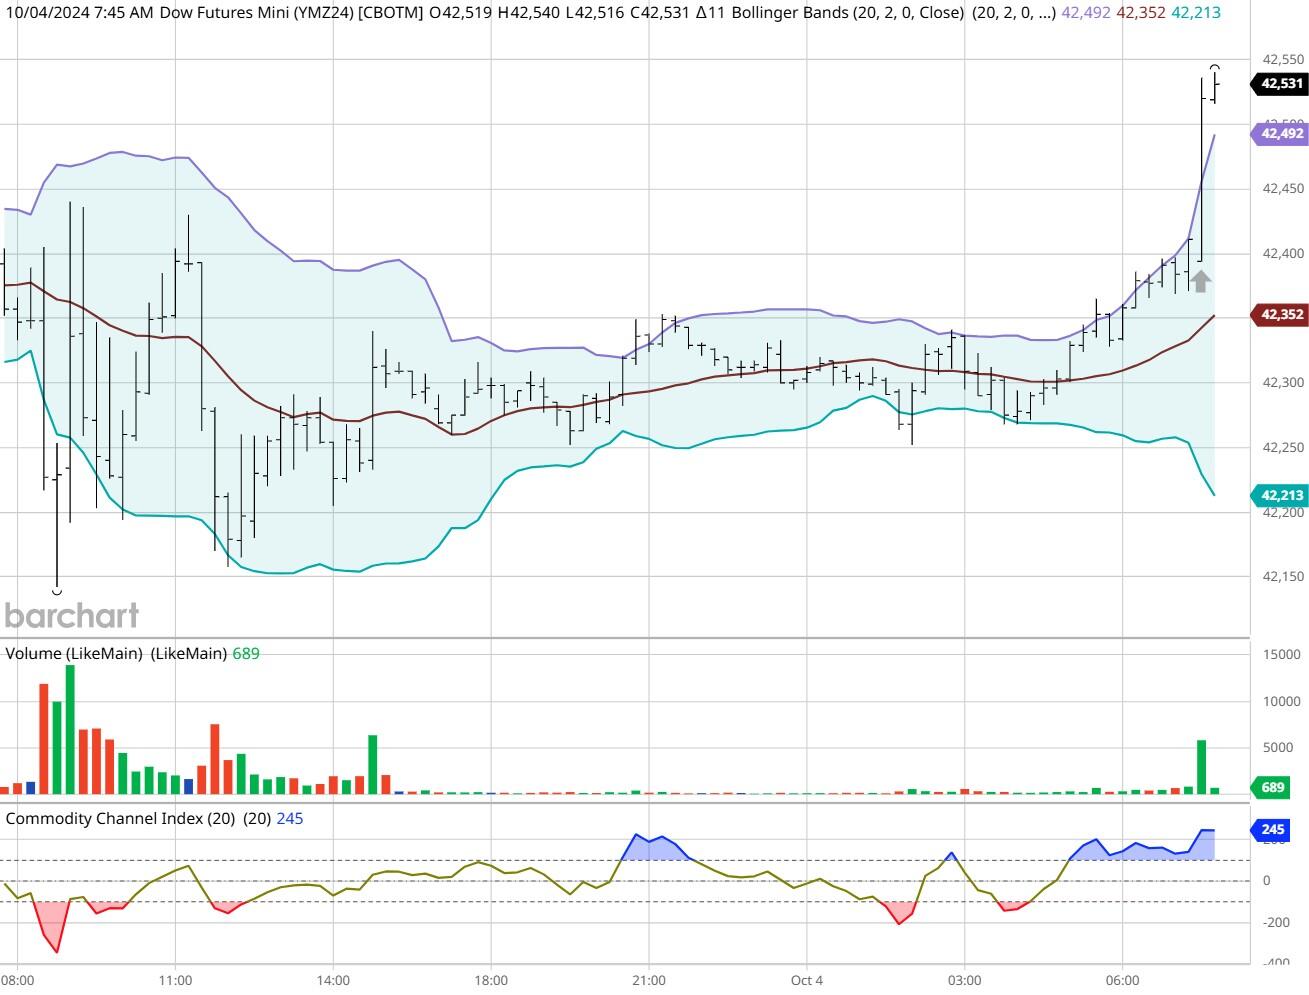
Dow - Dec 2024- 10/04/24

Bias

On Friday we gave the markets a Neutral or Mixed bias as it was Jobs Friday, and we always maintain a Neutral bias on that day.  The markets veered to the Upside as the Dow gained 341 points on the day and the other indices gained ground as well.  Today we aren't dealing with a correlated market and our bias is to the Downside.

Could this change? Of Course. Remember anything can happen in a volatile market.

Commentary

Well, another Jobs Friday came and went and to our surprise the numbers reported were very good.  The US economy created 254,000 net new jobs versus the expectation of 147,000.  Both political parties will take aim at this, but the Democrats have far more to gain as they can said with authority that "Bidenomics" is working and creating more opportunity.  The GOP will probably say the numbers are wrong, it's fake, its phony but the proof is there.  Today we are light on economic news, but we do have a couple of FOMC members speaking this afternoon, so time will tell.

Trading performance displayed herein is hypothetical. The following Commodity Futures Trading Commission (CFTC) disclaimer should be noted.

Hypothetical performance results have many inherent limitations, some of which are described below. No representation is being made that any account will or is likely to achieve profits or losses similar to those shown.

In fact, there are frequently sharp differences between hypothetical performance results and the actual results subsequently achieved by any particular trading program. One of the limitations of hypothetical performance trading results is that they are generally prepared with the benefit of hindsight.

In addition, hypothetical trading does not involve financial risk, and no hypothetical trading record can completely account for the impact of financial risk in actual trading. For example, the ability to withstand losses or to adhere to a particular trading program in spite of trading losses are material points which can also adversely affect actual trading results.

There are numerous other factors related to the markets in general or to the implementation of any specific trading program which cannot be fully accounted for in the preparation of hypothetical performance results and all of which can adversely affect actual trading results.

Trading in the commodities markets involves substantial risk and YOU CAN LOSE A LOT OF MONEY, and thus is not appropriate for everyone. You should carefully consider your financial condition before trading in these markets, and only risk capital should be used.

In addition, these markets are often liquid, making it difficult to execute orders at desired prices. Also, during periods of extreme volatility, trading in these markets may be halted due to so-called “circuit breakers” put in place by the CME to alleviate such volatility. In the event of a trading halt, it may be difficult or impossible to exit a losing position.

Recommended Content


Recommended Content

Editors’ Picks

EUR/USD stays below 1.1000 ahead of Fedspeak

EUR/USD stays below 1.1000 ahead of Fedspeak

EUR/USD moves sideways in a tight range below 1.1000 on Monday. The data from the Eurozone showed that Retail Sales rose by 0.2% on a monthly basis in August as forecast, failing to boost the Euro. Investors await comments from Fed officials.

EUR/USD News
GBP/USD struggles to recover above 1.3100

GBP/USD struggles to recover above 1.3100

GBP/USD stays under bearish pressure and trades in the red below 1.3100 on Monday, erasing early gains. The pair is undermined by a negative shift in risk sentiment but the downside remains limited as the US Dollar struggles to build on previous week's gains.

GBP/USD News
Gold retreats below $2,650, remains confined in a familiar trading range

Gold retreats below $2,650, remains confined in a familiar trading range

Gold price remains on the defensive amid reduced bets for a 50 bps Fed rate cut in November and trades below $2,650 to start the week. The USD consolidates last week’s strong gains and exerts some pressure as investors keep a close eye on geopolitics.

Gold News
Is “Uptober” here for Bitcoin?

Is “Uptober” here for Bitcoin?

Bitcoin stabilizes at around $63,000 on Monday. US spot Bitcoin ETF experienced outflows week-on-week. NYDIG report highlights that Bitcoin remains the best-performing asset this year, with a 49.2% year-to-date gain. 

Read more
RBA widely expected to keep key interest rate unchanged amid persisting price pressures

RBA widely expected to keep key interest rate unchanged amid persisting price pressures

The Reserve Bank of Australia is likely to continue bucking the trend adopted by major central banks of the dovish policy pivot, opting to maintain the policy for the seventh consecutive meeting on Tuesday.

Read more
Five best Forex brokers in 2024

Five best Forex brokers in 2024

VERIFIED Choosing the best Forex broker in 2024 requires careful consideration of certain essential factors. With the wide array of options available, it is crucial to find a broker that aligns with your trading style, experience level, and financial goals. 

Read More

Majors

Cryptocurrencies

Signatures