Jerome Powell to testify in the US Congress – Will his speech solidify market direction?

USD: Mar '24 is Down at 103.570.
Energies: Apr '24 Crude is Up at 78.96.
Financials: The June '24 30 Year T-Bond is Down 13 ticks and trading at 120.14.
Indices: The Mar '24 S&P 500 emini ES contract is 66 ticks Higher and trading at 5102.25.
Gold: The Apr'24 Gold contract is trading Down at 2140.40.
Initial conclusion
This is not a correlated market. The USD is Down and Crude is Up which is normal, and the 30 Year T-Bond is trading Lower. The Financials should always correlate with the US dollar such that if the dollar is Higher, then the bonds should follow and vice-versa. The S&P is Higher and Crude is trading Higher which is not correlated. Gold is trading Lower which is not correlated with the US dollar trading Down. I tend to believe that Gold has an inverse relationship with the US Dollar as when the US Dollar is down, Gold tends to rise in value and vice-versa. Think of it as a seesaw, when one is up the other should be down. I point this out to you to make you aware that when we don't have a correlated market, it means something is wrong. As traders you need to be aware of this and proceed with your eyes wide open. Asia is trading Higher with the exception of the Nikkei and Shanghai exchanges which are Lower. Currently all of Europe is trading Higher with the exception of the Paris and Dax exchanges which are Lower.
Possible challenges to traders
-
ADP Non-Farm Employment Change is out at 8:15 AM EST. This is Major.
-
Fed Chair Powell Testifies at 10 AM EST. This is Major.
-
JOLTS Job Openings is out at 10 AM EST. This is Major.
-
Final Wholesale Inventories m/m is out at 10 AM EST. This is Major.
-
Crude Oil Inventories is out at 10:30 AM EST. This is Major.
-
FOMC Member Daly Speaks at 12 noon EST. This is Major.
-
Beige Book is out at 2 PM EST. This is Major.
Treasuries
Traders, please note that we've changed the Bond instrument from the 30 year (ZB) to the 10 year (ZN). They work exactly the same.
We've elected to switch gears a bit and show correlation between the 10-year bond (ZN) and the S&P futures contract. The S&P contract is the Standard and Poor's, and the purpose is to show reverse correlation between the two instruments. Remember it's likened to a seesaw, when up goes up the other should go down and vice versa.
Yesterday the ZN migrated Higher at around 10 AM EST as the S&P hit a High at around the same time. If you look at the charts below the S&P gave a signal at around 10 AM and the ZN started its Upward climb. Look at the charts below and you'll see a pattern for both assets. S&P hit a High at around 10 AM and migrated Lower. These charts represent the newest version of MultiCharts and I've changed the timeframe to a 15-minute chart to display better. This represented a Long opportunity on the 10-year note, as a trader you could have netted about 20 ticks per contract on this trade. Each tick is worth $15.625. Please note: the front month for the ZN is now Jun '24. The S&P contract is still Mar' 24. I've changed the format to filled Candlesticks (not hollow) such that it may be more apparent and visible.
Charts courtesy of MultiCharts built on an AMP
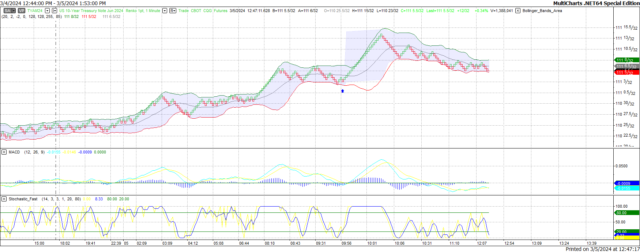
ZN -Jun 2024 - 03/05/24
-638453263857297494.png)
S&P - Mar 2024 - 03/05/24
Bias
Yesterday we gave the markets a Downside Bias as both the USD and the Bonds were Higher Tuesday morning and that does bode well for a Downside Day. The markets didn't disappoint as the Dow dropped 405 points and the other indices lost ground as well. Today we aren't dealing with a correlated market and our bias is to the Upside.
Could this change? Of Course. Remember anything can happen in a volatile market.
Commentary
Maybe it was because yesterday was Super Tuesday with 16 states holding primary elections but from the moment we looked at the markets we could tell it wouldn't be a stellar growth day. All the indices traded Lower with the Dow and Nasdaq in negative triple digit territory. Today we will hear the Fed Chair speaking to a Congressional Committee, and we hope that it will solidify market direction. But as in all things, only time will tell.
Author

Nick Mastrandrea
Market Tea Leaves


