Is the Fed to blame for a potential stock market bubble?
- FOMC Chairman Powell downplays significant increases in asset valuations.
- Secular stagnation theory argues ultra-loose policy is inflating an asset bubble.
- A correction in stocks markets is likely when the Fed starts removing support.

The Wall Street chaos that was fueled by retail investors who used social media channels to organize a mass purchase of specific stocks, which were shorted by large hedge funds, revived fears over a bubble forming in the stock markets.
Following the Federal Open Market Committee's (FOMC) January meeting, Chairman Jerome Powell refrained from commenting on asset valuations in his prepared remarks. Nevertheless, with the first question, Jeanna Smialek from the New York Times asked Powell what the Fed was planning to do to deal with financial stability risks emerging in the non-bank sector given that macroprudential tools only apply to banks. Powell said he wouldn’t comment on specific market activity and noted that they work closely with the Financial Stability Oversight Council despite the fact that the Fed does not have jurisdiction over many areas in the non-bank sector.
Powell failed to throw a veil over the matter with this response and was asked to address the criticism that the Fed’s ultra-loose monetary policy was inflating an asset bubble that could cause an economic fallout should it burst. “If you look at where it’s really been driving asset prices, really in the last couple of months, it isn’t monetary policy,” Powell told reporters. “It’s been expectations about vaccines and it’s also fiscal policy. Those are the news items that have been driving asset purchases.” He further went on to explain that their policy decisions were designed to counter the unprecedented economic crisis that was caused by the coronavirus pandemic.
“The connection between low interest rates and asset values is probably something that’s not as tight as people think because a lot of different factors are driving asset prices at any given time,” the Chairman concluded.
Secular stagnation and US sectoral balance
The theory of ‘secular stagnation’ in economics refers to a slowdown in economic activity due to a lack of demand, as characterized by a stronger tendency toward saving and diminishing investment. In that state, interest rates are reduced to discourage saving while ramping up investment. In turn, the low-rate environment forces investors to lean toward high-yielding assets, such as stocks and cryptocurrencies, paving the way for price appreciation regardless of underlying fundamentals.
In an article published on the International Monetary Fund’s (IMF) website in March, Lawrence H. Summers, Charles W. Eliot University Professor at Harvard University, said that secular stagnation is the only plausible theory that can explain sluggish growth in the face of hyperexpansionary policies.
“Ensuring that economies fulfill their potential is a challenge that logically comes before increasing their potential. Financial stability is as much at risk from low rates as high rates,” Summers argued. “The medium-term issue is the full absorption of savings rather than the crowding-out of investment.”
Additionally, in a blog post published on January 27th, Fabio M. Natalucci, the IMF’s Deputy Director of the Monetary and Capital Markets Department, noted that there is a disconnect between “exuberant financial markets” and the lagging economic recovery. “With investors betting on persistent policy backstop, a sense of complacency appears to be permeating markets; coupled with apparent uniform investor views, this raises the risk of a market correction,” Natalucci warned.
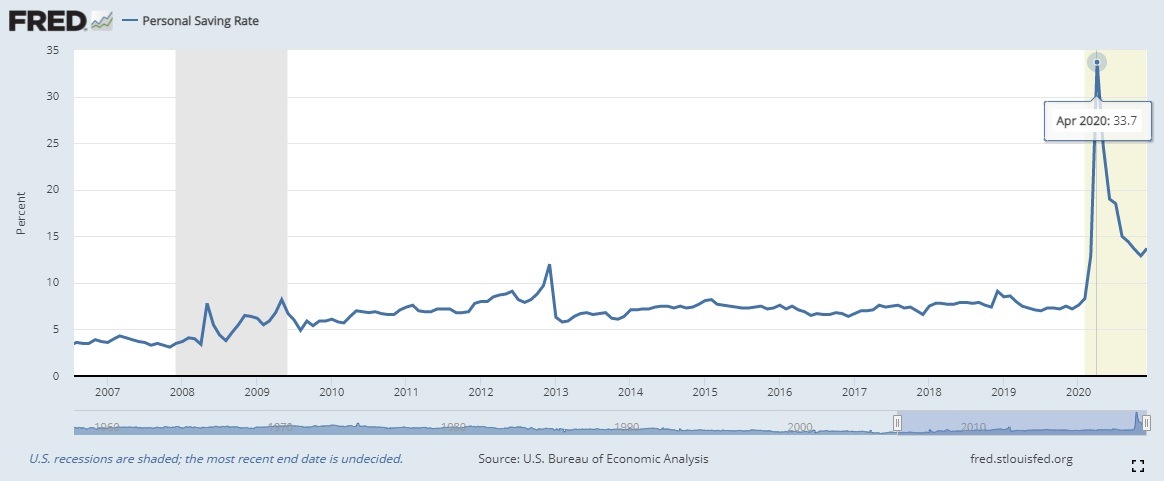
With the coronavirus outbreak resulting in a demand shock, the personal savings rate in the US surged to an all-time high of 33.7% in April. Although this measure fell steadily in the second half of 2020, it’s still nearly twice 2019’s average of 7.5%.
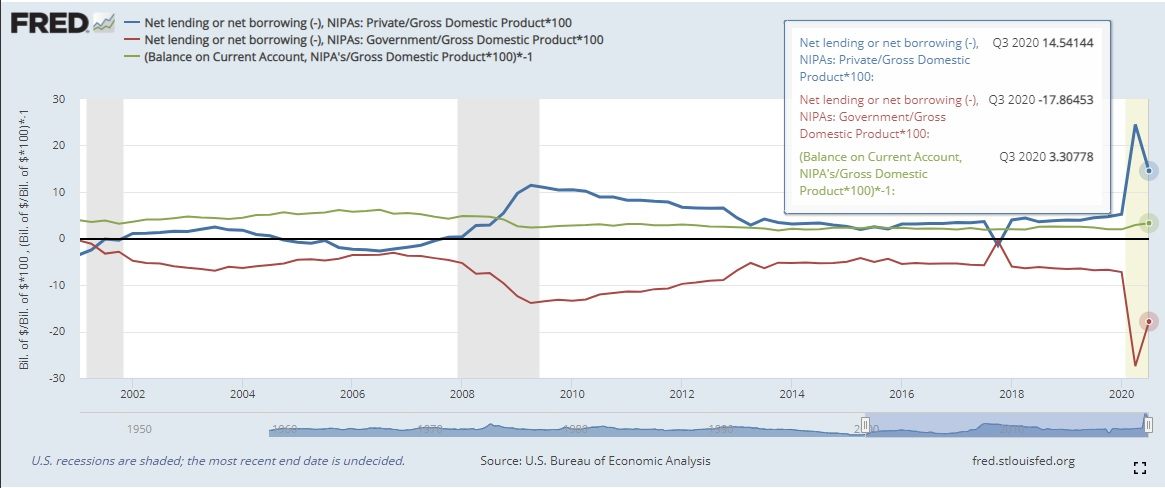
Reflecting the same sentiment, the sectoral balance chart shows how there was a private sector surplus of 24.5% and 14.5% of GDP in the second and the third quarters of 2020, respectively, which was offset by increased government budget deficit.
The Fed said that it will continue to increase its holdings of Treasury securities by at least $80 billion and of mortgage‑backed securities by at least $40 billion per month until it sees convincing progress towards employment and inflation goals. “These asset purchases help foster smooth market functioning and accommodative financial conditions, thereby supporting the flow of credit to households and businesses,” the bank reiterated in its latest policy statement.
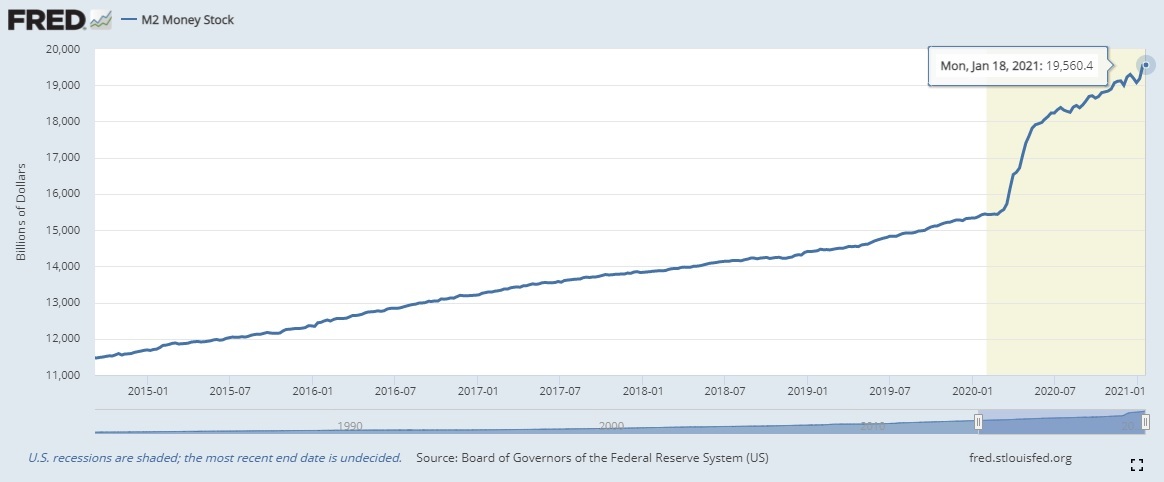
In the meantime, the M2 money supply, which includes cash and checking deposits (M1) and highly liquid assets that are not cash, shot up by nearly 27% to $19.5 trillion in January from $15.3 trillion a year ago.
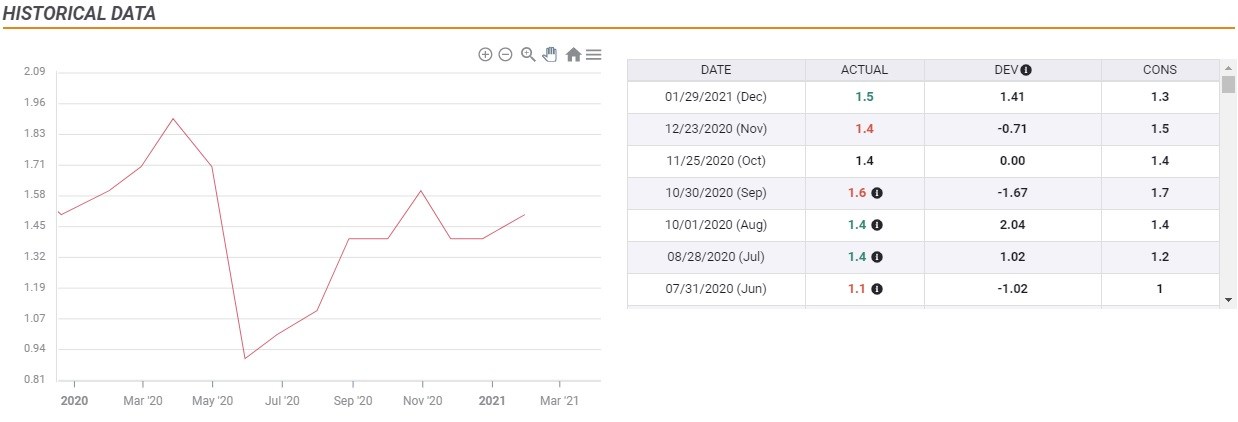
However, the latest data published by the US Bureau of Economic Analysis revealed that the Core Personal Consumption Expenditures (PCE) Price Index was 1.5% on a yearly basis in December, unchanged from a year ago.
What happens next?
To summarize the US macroeconomic picture in 2020, the private sector surplus expanded with a huge increase in the savings rate, the M2 money supply grew by nearly 27%, yet inflation remained relatively steady. At the same time, the S&P 500 and the Nasdaq Composite rose 16.3% and 43.6%, respectively.
So, the question remains the same: Is the Fed’s monetary policy establishing the ideal conditions for a stock market bubble? Powell thinks asset valuations are driven by recovery and vaccine optimism. On the other hand, the secular stagnation theory argues that the search for high-yielding assets in the current environment is creating inflation in assets prices rather than consumer prices.
One thing is for certain: The Fed’s current policy is not sustainable and the central bank will have to start pulling its support by tapering asset purchases at some point. When that happens, the severity and the length of the correction in equity markets will reveal which of those views was reflecting the reality.
A selloff in US stocks is likely to boost the demand for safe-haven US Treasury bonds and drive yields higher. Consequently, the US dollar could start outperforming its risk-sensitive rivals, such as European and antipodean currencies.
Author

Eren Sengezer
FXStreet
As an economist at heart, Eren Sengezer specializes in the assessment of the short-term and long-term impacts of macroeconomic data, central bank policies and political developments on financial assets.