GDP torpedoes markets

USD: Dec '24 is Down at 103.770.
Energies: Dec '24 Crude is Up at 68.96.
Financials: The Dec '24 30 Year T-Bond is Down 3 ticks and trading at 117.31.
Indices: The Dec '24 S&P 500 emini ES contract is 190 ticks Lower and trading at 5805.25.
Gold: The Dec'24 Gold contract is trading Down at 2786.70.
Initial conclusion
This is not a correlated market. The USD is Down and Crude is Up which is normal, and the 30 Year T-Bond is trading Lower. The Financials should always correlate with the US dollar such that if the dollar is Higher, then the bonds should follow and vice-versa. The S&P is Lower and Crude is trading Higher which is correlated. Gold is trading Lower which is not correlated with the US dollar trading Down. I tend to believe that Gold has an inverse relationship with the US Dollar as when the US Dollar is down, Gold tends to rise in value and vice-versa. Think of it as a seesaw, when one is up the other should be down. I point this out to you to make you aware that when we don't have a correlated market, it means something is wrong. As traders you need to be aware of this and proceed with your eyes wide open. Asia traded mainly Lower with the exception of the Shanghai trading Higher. All of Europe is trading Lower.
Possible challenges to traders
-
Challenger JOB Cuts y/y is out at 7:30 AM EST. This is Major.
-
Core PCE Price Index m/m is out at 8:30 AM EST. This is Major.
-
Employment Cost Index q/q is out at 8:30 AM EST. This is Major.
-
Unemployment Claims is out at 8:30 AM EST. This is Major.
-
Personal Income m/m is out at 8:30 AM EST. This is Major.
-
Personal Spending is out at 8:30 AM EST. This is Major.
-
Chicago PMI is out ay 9:45 AM EST. This is Major.
-
Natural Gas Storage is out at 10:30 AM EST. This is Major.
Traders, please note that we've changed the Bond instrument from the 10 year (ZN) to the 2 year (ZT). They work exactly the same.
We've elected to switch gears a bit and show correlation between the 2-year Treasury notes (ZT) and the S&P futures contract. The YM contract is the Dow Jones Industrial Average, and the purpose is to show reverse correlation between the two instruments. Remember it's likened to a seesaw, when up goes up the other should go down and vice versa.
Yesterday the ZT slide Lower at around 8:30 AM EST as the GDP numbers was released. The Dow crept Higher at the same time and began its Upward climb. Look at the charts below and you'll see a pattern for both assets. The Dow moved Higher at 8:30 AM and the ZT moved Lower at around the same time. These charts represent the newest version of Bar Charts, and I've changed the timeframe to a 15-minute chart to display better. This represented a Short opportunity on the 2-year note, as a trader you could have netted about 30 plus ticks per contract on this trade. Each tick is worth $7.625. Please note: the front month for ZT is Dec and the Dow is now Dec '24. I've changed the format to filled Candlesticks (not hollow) such that it may be more apparent and visible.
Charts courtesy of barcharts
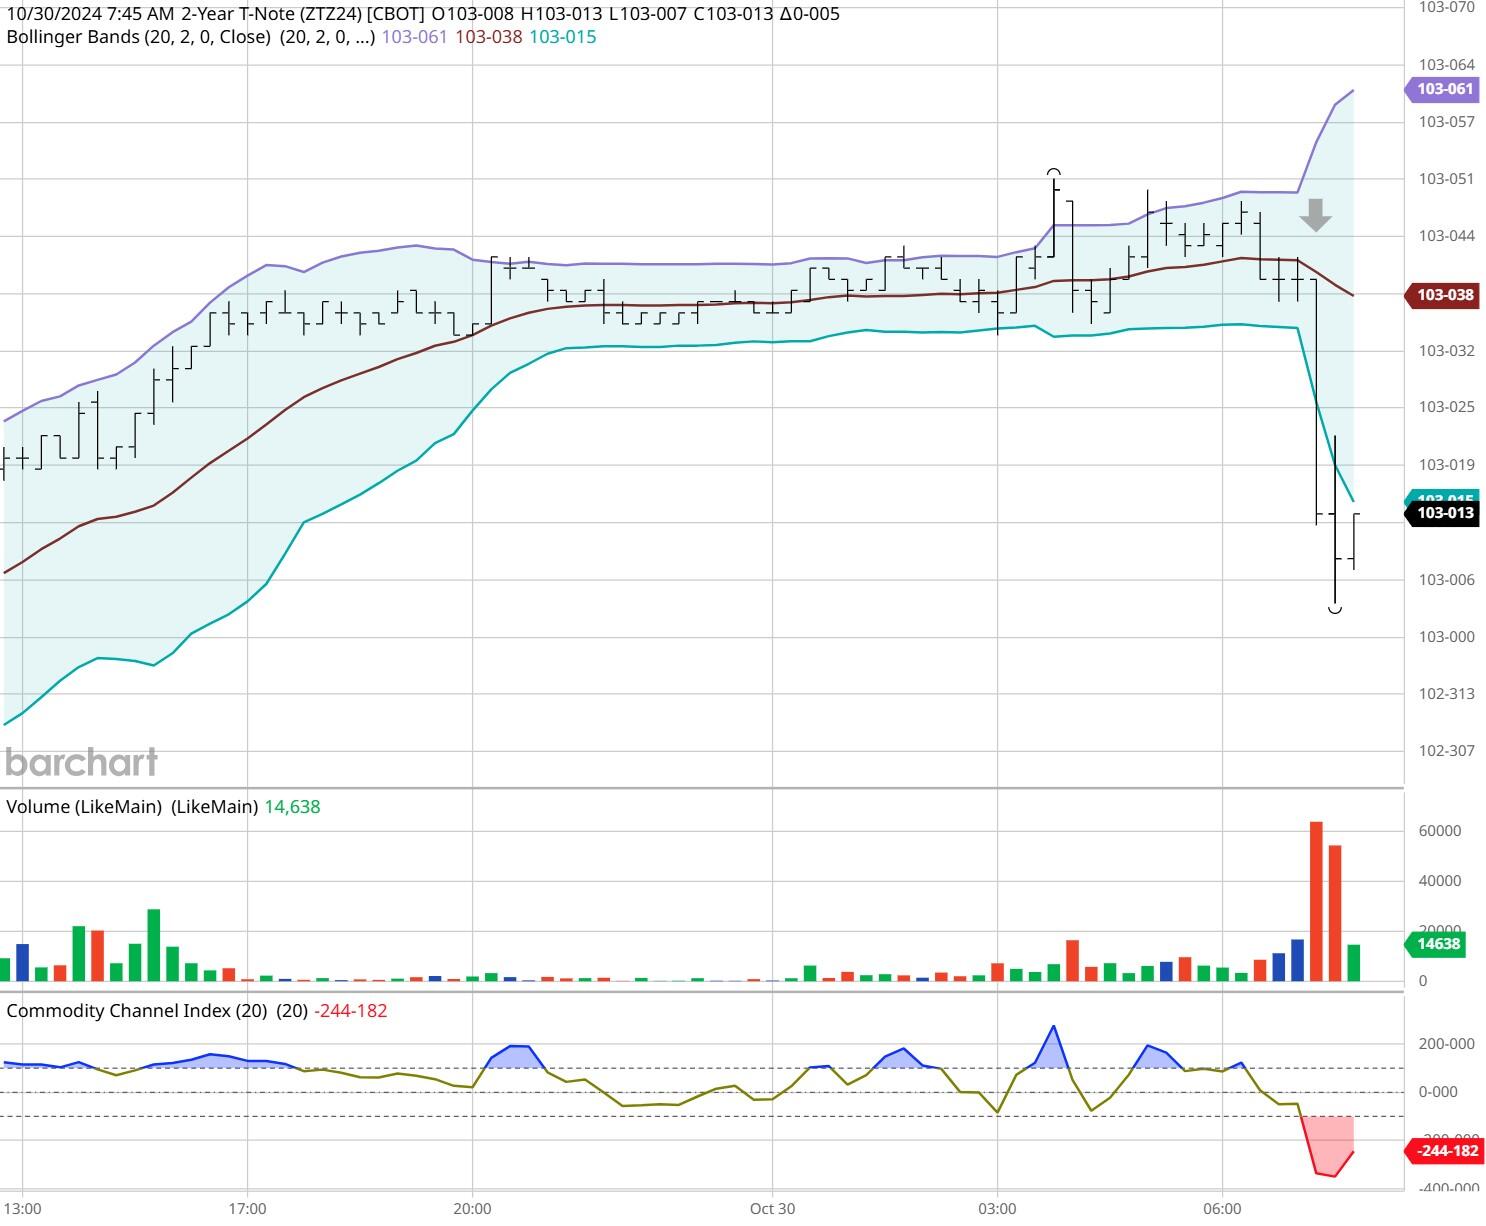
ZT -Dec 2024 - 10/30/24
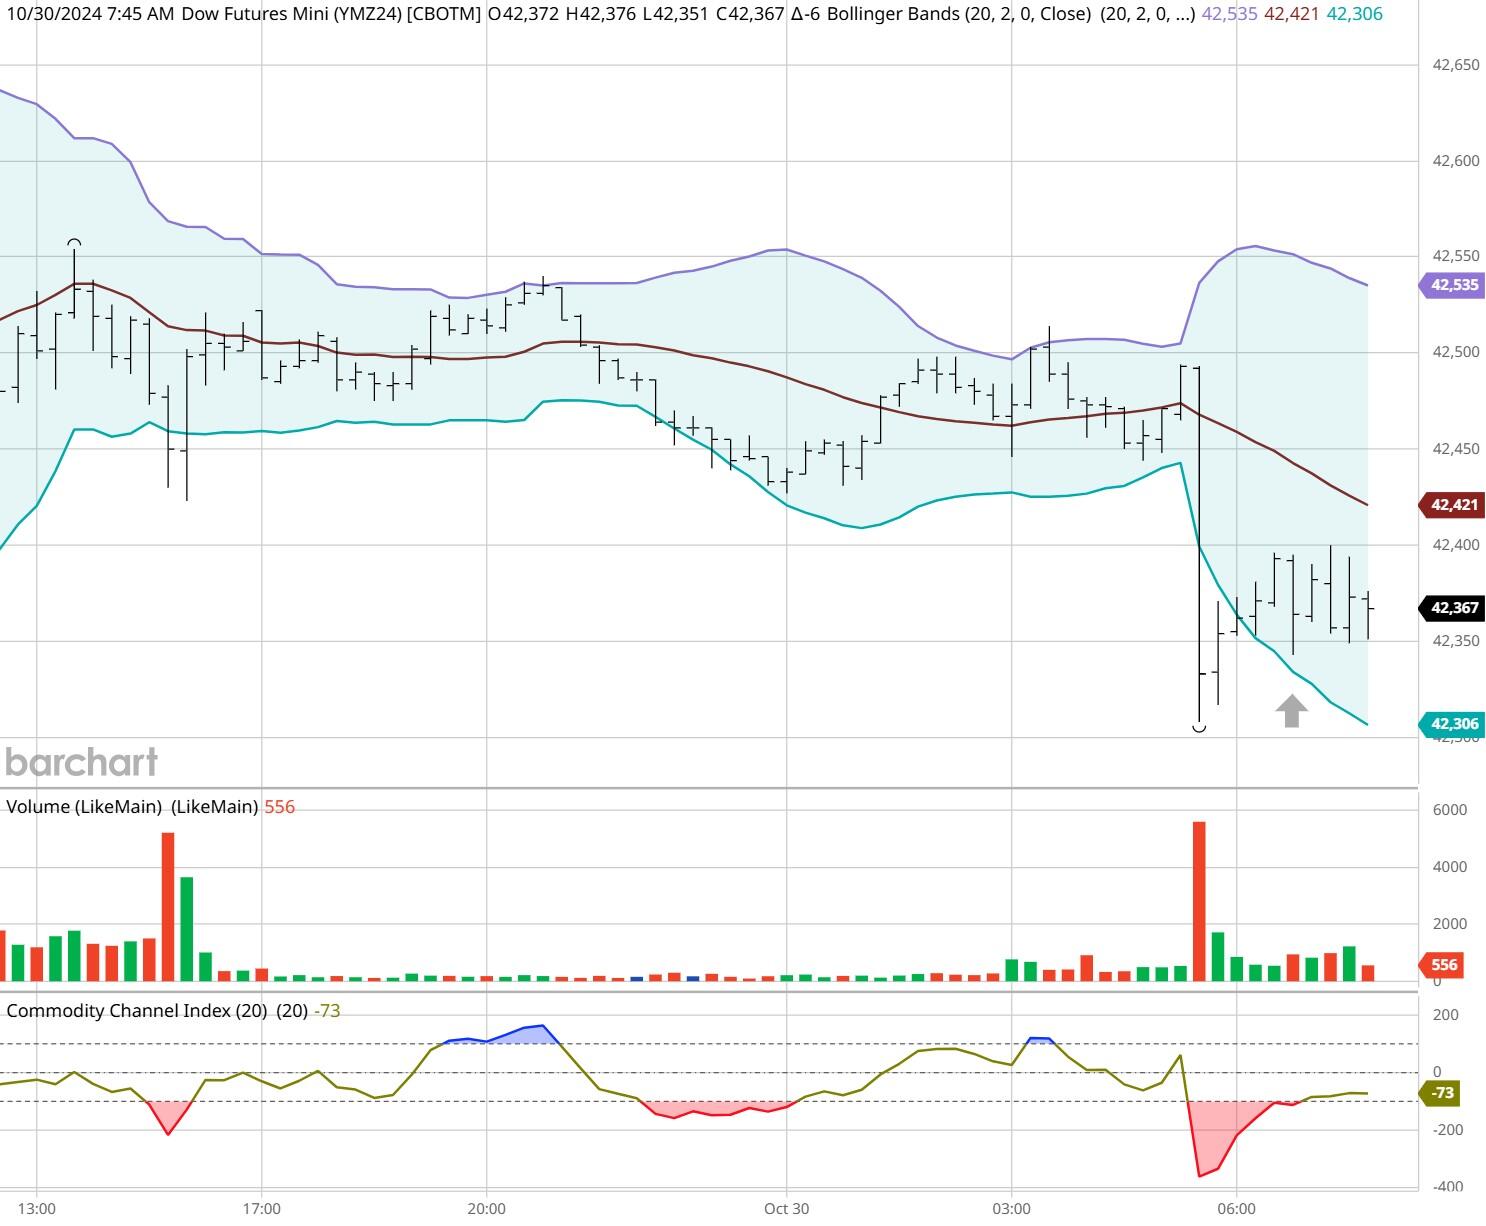
Dow - Dec 2024- 10/30/24
Bias
Yesterday we gave the markets a Neutral or Mixed bias as we saw no evidence of Market Wednesday morning. The markets traded complelty to the Downside as the Dow closed points Lower and the other indices closed Lower as well. Today we aren't dealing with a correlated market and our bias is Neutral.
Could this change? Of Course. Remember anything can happen in a volatile market.
Commentary
So, the GDP numbers came and went and unfortunately the markets traded Lower. Why? The GDP numbers did not meet expectation, and the markets closed Lower. Mind you not by much but Lower, nonetheless. Today we have Personal Income and Spending as well as Chicago PMI and weekly Unemployment Claims. This will no doubt set the stage for tomorrow's Jobs Report.
Author

Nick Mastrandrea
Market Tea Leaves


