From bold to boring

After a rollicking spring rally, gold has settled into a trading range that seems typical for a summertime slowdown. One indicator is now pointing toward a big surprise soon, however.
If we pause a moment to look back at what gold did over the last four weeks, we see that it went a long way to go nowhere.
Remember the big story at the beginning of June? Back then, we were talking about the newfound volatility that gold and silver were experiencing. After a nearly unbroken string of new highs over the first six weeks of the spring rally, the metals had settled into a more normal pattern of peaks and valleys.
The good news, I noted then, was that gold was setting higher highs and higher lows, and thus the bull market thesis was intact.
Unfortunately, that pattern soon changed as well.
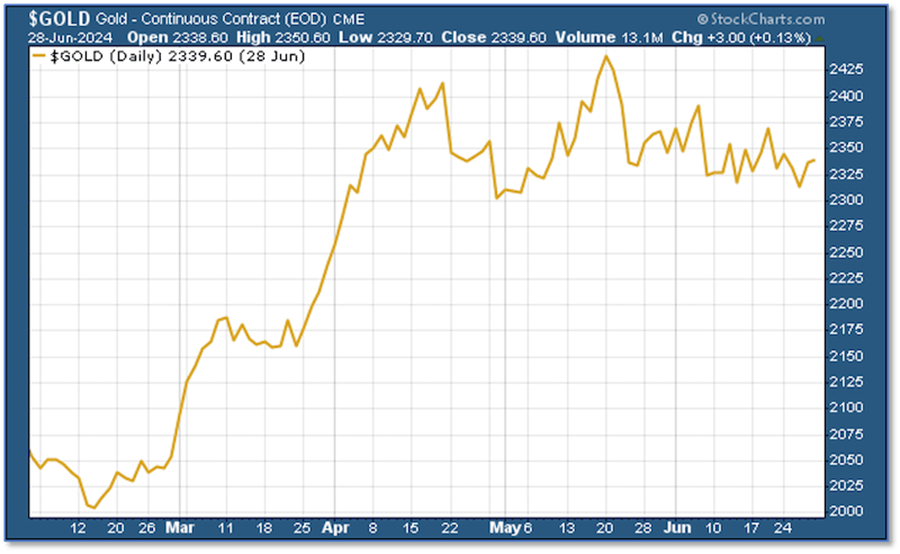
Since then, as you can see from the five-month price chart below, the price failed to set those higher highs and lows and has now settled into the kind of sideways trading pattern characteristic of the usual summer doldrums.v
At the same time, a number of analysts/pundits have been predicting a major sell-off in gold — the typical “one more dive lower before the next big move higher” predictions.
As I’ve said before, these kinds of statements are common at market junctures like these (and actually often come right before a major price breakout). It's more a rhetorical safety net than a prediction — you could be 100% right, but you can never be 100% wrong.
All this said, the odds appear to favor a summertime slowdown for the next month or two, with gold remaining in a trading range.
However, one interesting indicator is now flashing a signal for a potential price breakout at any time...
Falling volatility can lead to rising prices
The Bollinger Bands volatility gauge has been a fairly reliable technical indicator for asset prices in general and gold specifically. As long-time readers know, I track gold’s Bollinger Bands because when they narrow (indicating falling volatility), that event often presages a breakout in either direction.
Importantly, if the price is in an uptrend, this breakout is usually to the upside. And gold, as we know, has been in quite an uptrend.
Consider the accompanying chart, on which I’ve marked occasions when the Bollinger bands have “pinched,” as shown by their width in the bottom panel.
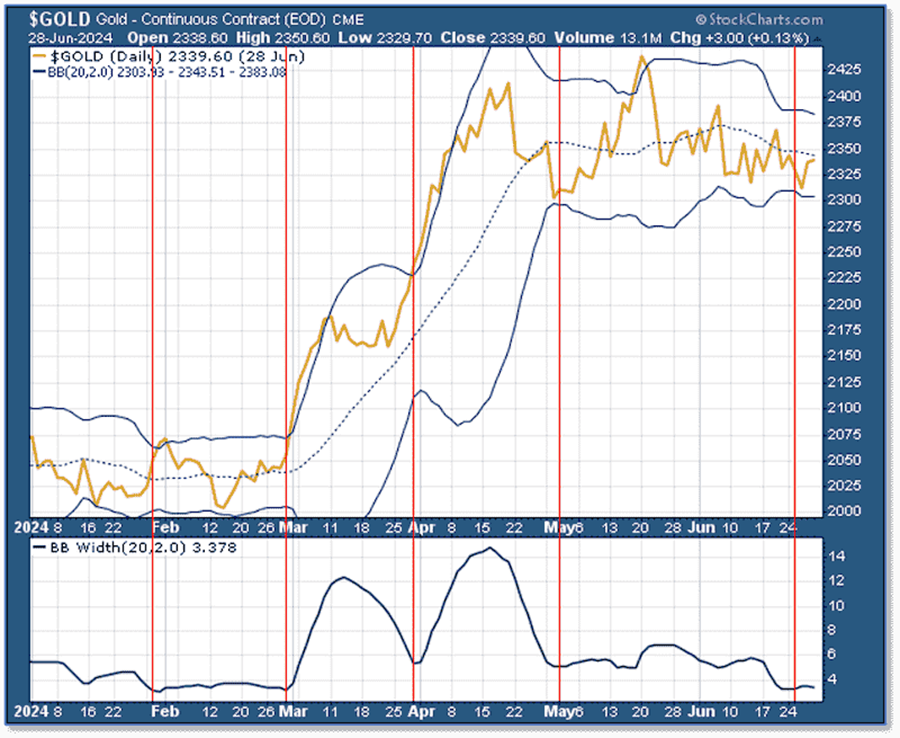
As you can see, every time the bandwidth has bottomed while gold has been in an uptrend, we’ve seen a quick, subsequent move higher. The bottom in the bandwidth that occurred in late January came before gold had begun its rally, and in any case, didn’t mark a significant fall from higher levels.
So has the Bollinger-band width bottomed and is this predicting an imminent price breakout?
We’ll soon find out.
Regardless, the fundamental picture is still arguing for a renewed move higher at some point over the next couple of months. If we’re in a typical summer doldrums kind of market, the record shows that the price of gold will bottom sometime between mid-July and mid-August.
In addition, I believe the markets are going to begin pricing in a Fed rate cut by next month.
Bottom line: Even if we don’t get a breakout soon as predicted by the pinching Bollinger bands, we seem likely to see a renewed bull run within the next month or two.
To receive free commentary and analysis on the gold and silver markets, click here to be added to the Money Metals news service.
Author

Brien Lundin
Money Metals Exchange
Brien Lundin is the publisher and editor of Gold Newsletter, the publication that has been the cornerstone of precious metals advisories since 1971. Mr. Lundin covers not only resource stocks but also the entire world of investing.


